


Bitcoin BTC/USD are traded at the level of 7040 and continue to move within a bearish trend. At this point, we should expect an attempt to test the upper boundary of the channel near the level of 7250. Where again we should expect a rebound and an attempt to continue the Bitcoin drop with a target below the level of 5800.
Bitcoin (BTC/USD) technical analysis April 1, 2018
In favor of falling quotes BTC/USD will perform a downtrend test on the indicator of relative strength index (RSI). The cancellation of the Bitcoin drop option will result in a strong growth and breakdown of the 7600 area, which will indicate the breakdown of the upper boundary of the descending channel and the continuation of growth above the level of 8300. A breakdown of the support area and the closure below the level of 6400 will prove the development of the bearish trend.
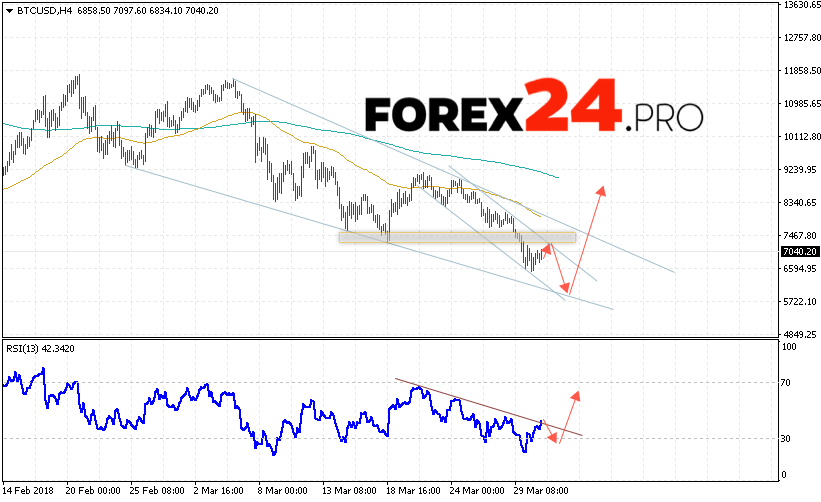
Bitcoin (BTC/USD) technical analysis April 1, 2018 suggests an attempt to test the resistance area near the 7250 level and continue falling with a potential target at 5800, an additional signal in favor of the Bitcoin drop will be a trend line test on the relative strength index (RSI).
Looking for the Best Forex Broker? We trade at RoboForex. You can receive a rebates from each trade when registering using our partner link