FOREX24.PRO
    FOREX24.PRO
    • Home
    • FOREX
      • EUR/USD Forecast
      • GBP/USD Forecast
      • USD/JPY Forecast
      • USD/CHF Forecast
      • USD/CAD Forecast
      • AUD/USD Forecast
      • NZD/USD Forecast
    • Crypto
      • Bitcoin Forecast
      • Dash Forecast
      • Ethereum Forecast
      • Litecoin Forecast
      • Ripple Forecast
      • Zcash Forecast
    • Indices
      • DOW JONES Forecast
      • S&P 500 Forecast
      • DAX 30 Forecast
      • NASDAQ 100 Forecast
      • FTSE 100 Forecast
      • NIKKEI 225 Forecast
    • Commodities
      • BRENT Forecast
      • WTI Forecast
      • XAU/USD Forecast
      • XAG/USD Forecast
      • NATURAL GAS Forecast
      • Aluminum Forecast
      • Platinum Forecast
    • Brokers
    • Charts
      • Ethereum Chart
      • EUR/USD Chart
      • GBP/USD Chart
      • USD/JPY Chart
      • USD/CHF Chart
      • USD/CAD Chart
      • AUD/USD Chart
      • NZD/USD Chart
      • Brent Oil Chart
      • GOLD chart
    • Trader
      • Economic Calendar
      • Open Forex Positions
      • Central bank interest rates
      • Forex Trading Signals
      • Make Money Forex Trading
      • Forex Forecast Videos
    FOREX24.PRO
    Home»DAX 30 Forecast»Bollinger Bands Forecast DAX 30 on March 30, 2017
    Ichimoku Kinko Hyo DAX 30 forecast on April 24, 2017
    DAX 30 Forecast

    Bollinger Bands Forecast DAX 30 on March 30, 2017

    forex24proBy forex24proMarch 29, 2017No Comments1 Min Read
    Get $30 free for trading!

    The stock index DAX 30 is trading at 12198.3. DAX 30 is trading above the moving average with a period of 55, indicating a bullish trend for the DAX 30. At the moment, stock market quotes are testing the upper boundary of the Bollinger Bands indicator bars. One should expect an attempt to drop and test the middle border of the bands near the 12100 level, where again we should expect an attempt to continue growth with the first target near the level of 12,280.

    Bollinger Bands Forecast DAX 30 on March 30, 2017

    Bollinger Bands Forecast DAX 30 on March 30, 2017

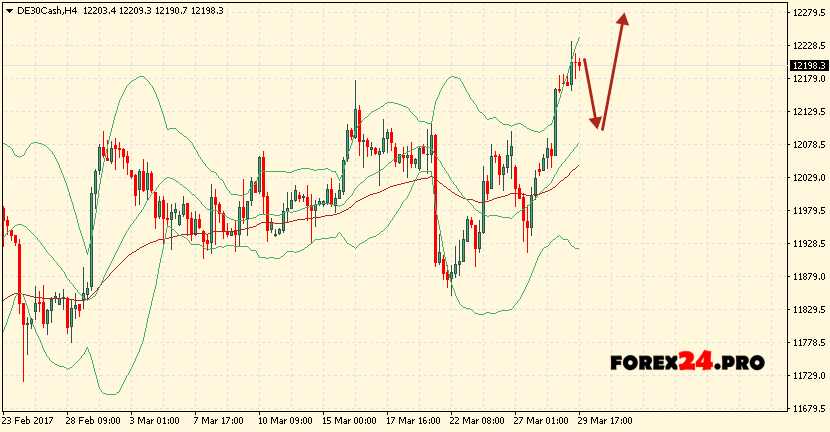
    The conservative buy area is located near the lower border of the Bollinger Bands indicator strip at 11930. By abolishing the DAX 30 growth option, Breakdown of the lower boundary area, as well as the moving average and the closing of quotes below the area of 11880, which indicates a change in the trend in favor of the bearish on the DAX 30. In the event of a breakdown of the upper boundary of the indicator bars, rhenium growth of stock indices in the region above the level of 12280.

    Join our Telegram Channel
    Share. Facebook Twitter Pinterest LinkedIn Tumblr Email
    forex24pro
    • Website
    • Twitter

    I trade in the foreign exchange market, and also invest in cryptocurrencies. I am 35 years old. Trade experience is 12 years. In trade, I use several unique trading systems, as well as simple tools for technical analysis. I plan to write my own book on trading.

    Related Posts

    DAX 30 Index Forecast and Analysis April 14, 2020

    April 13, 2020

    DAX 30 Index Forecast and Analysis January 10, 2020

    January 9, 2020

    DAX 30 Index Forecast and Analysis December 19, 2019

    December 18, 2019

    DAX 30 Index Forecast and Analysis December 13, 2019

    December 12, 2019
    Add A Comment

    Leave A Reply Cancel Reply

    Top Brokers

    RoboForex
    Trade with RoboForex ›
    Exness
    Trade with Exness ›
    XM
    Trade with XM ›

    EUR/USD Forecast Euro Dollar for March 10, 2026

    March 9, 2026

    GBP/USD Forecast and Analysis for March 10, 2026

    March 9, 2026

    Australian Dollar Forecast AUD/USD for March 10, 2026

    March 9, 2026

    USD/JPY Forecast Japanese Yen for March 10, 2026

    March 9, 2026
    Recent Comments
    • Madu on GOLD Forecast and XAU/USD Analysis for January 7, 2026
    • Enji on GOLD Forecast and XAU/USD Analysis for August 27, 2025
    • Maria Devis on Key Advantages Of Investing In Gold
    • Ramanathan on GOLD Weekly Forecast March 3 — 7, 2025
    • Nova riens on USD/JPY Forecast Japanese Yen for February 4, 2025
    Brent oil Forecast

    Brent Weekly Forecast March 9 – 13, 2026

    By forex24proMarch 7, 2026

    Brent Weekly Forecast March 9 – 13, 2026 suggests an attempt to test the resistance area near 80.45.

    EUR/USD Weekly Forecast March 9 – 13, 2026

    March 7, 2026

    GBP/USD Weekly Forecast March 9 – 13, 2026

    March 7, 2026
    FOREX24.PRO

    Free analytics FOREX. Trading signals and recommendations. Examples of transactions on the basis of forex forecasts. Quality articles about Forex. For advertising please contact us at our email

    forex24pro.manager@gmail.com

    CFDs and Forex are complex instruments and come with a high risk of losing money. You should consider whether you understand how CFDs and Forex work and whether you can afford to take the high risk of losing your money.

    Recent Posts
    • EUR/USD Forecast Euro Dollar for March 10, 2026
    • GBP/USD Forecast and Analysis for March 10, 2026
    • Australian Dollar Forecast AUD/USD for March 10, 2026
    • USD/JPY Forecast Japanese Yen for March 10, 2026
    • Brent crude oil Forecast for March 10, 2026
    Recent Comments
    • Madu on GOLD Forecast and XAU/USD Analysis for January 7, 2026
    • Enji on GOLD Forecast and XAU/USD Analysis for August 27, 2025
    • Maria Devis on Key Advantages Of Investing In Gold
    • Ramanathan on GOLD Weekly Forecast March 3 — 7, 2025

    Type above and press Enter to search. Press Esc to cancel.