FOREX24.PRO
    FOREX24.PRO
    • Home
    • FOREX
      • EUR/USD Forecast
      • GBP/USD Forecast
      • USD/JPY Forecast
      • USD/CHF Forecast
      • USD/CAD Forecast
      • AUD/USD Forecast
      • NZD/USD Forecast
    • Crypto
      • Bitcoin Forecast
      • Dash Forecast
      • Ethereum Forecast
      • Litecoin Forecast
      • Ripple Forecast
      • Zcash Forecast
    • Indices
      • DOW JONES Forecast
      • S&P 500 Forecast
      • DAX 30 Forecast
      • NASDAQ 100 Forecast
      • FTSE 100 Forecast
      • NIKKEI 225 Forecast
    • Commodities
      • BRENT Forecast
      • WTI Forecast
      • XAU/USD Forecast
      • XAG/USD Forecast
      • NATURAL GAS Forecast
      • Aluminum Forecast
      • Platinum Forecast
    • Brokers
    • Charts
      • Ethereum Chart
      • EUR/USD Chart
      • GBP/USD Chart
      • USD/JPY Chart
      • USD/CHF Chart
      • USD/CAD Chart
      • AUD/USD Chart
      • NZD/USD Chart
      • Brent Oil Chart
      • GOLD chart
    • Trader
      • Economic Calendar
      • Open Forex Positions
      • Central bank interest rates
      • Forex Trading Signals
      • Make Money Forex Trading
      • Forex Forecast Videos
    FOREX24.PRO
    Home»Indices»Index NASDAQ Forecast & Analysis on June 29, 2017
    USD/RUB Forecast Weekly Forecast April 10 — 14, 2023
    Indices

    Index NASDAQ Forecast & Analysis on June 29, 2017

    forex24proBy forex24proJune 28, 2017No Comments1 Min Read
    Get $30 free for trading!

    Stock Index NASDAQ is trading at 5671.8. NASDAQ broke through the Cloud of Ichimoku Kinko Hyo and began to trade below its lower limit, indicating a bearish trend in the NASDAQ. Ichimoku Kinko Hyo Cloud is expected to test near the level of 5730.0, from which one should expect an attempt to drop and develop a bearish trend on the NASDAQ stock exchange index in order to decrease near the level of 5510.0.

    Index NASDAQ Forecast & Analysis on June 29, 2017

    Index NASDAQ Forecast & Analysis on June 29, 2017

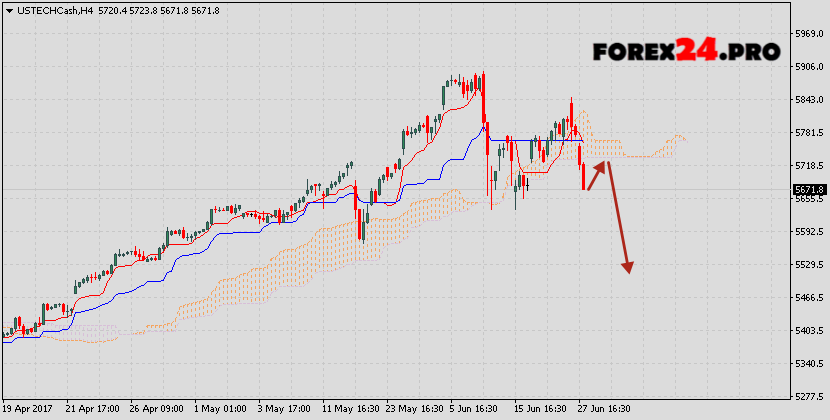
    Earlier, a medium strength signal was obtained for the NASDAQ exchange index sales, by crossing the signal lines at the level of 5765.0. Canceling the variant of falling quotations of the stock index will be the breakdown of the upper boundary of the Cloud of Ichimoku Kinko Hyo with the closing of quotations above the area of ​​5830.0, which will indicate a change in the bearish trend in favor of the bullish trend. Expect to accelerate the fall in quotations of NASDAQ stock index, with a breakdown of the local minimum area at 5560.0.

    Join our Telegram Channel
    Share. Facebook Twitter Pinterest LinkedIn Tumblr Email
    forex24pro
    • Website
    • Twitter

    I trade in the foreign exchange market, and also invest in cryptocurrencies. I am 35 years old. Trade experience is 12 years. In trade, I use several unique trading systems, as well as simple tools for technical analysis. I plan to write my own book on trading.

    Related Posts

    S&P 500 Forecast and Analysis for September 11, 2024

    September 10, 2024

    S&P 500 Forecast and Analysis for September 6, 2024

    September 5, 2024

    S&P 500 Forecast and Analysis for September 5, 2024

    September 4, 2024

    S&P 500 Forecast and Analysis for September 4, 2024

    September 3, 2024
    Add A Comment

    Leave A Reply Cancel Reply

    Top Brokers

    RoboForex
    Trade with RoboForex ›
    Exness
    Trade with Exness ›
    XM
    Trade with XM ›

    EUR/USD Forecast Euro Dollar for March 10, 2026

    March 9, 2026

    GBP/USD Forecast and Analysis for March 10, 2026

    March 9, 2026

    Australian Dollar Forecast AUD/USD for March 10, 2026

    March 9, 2026

    USD/JPY Forecast Japanese Yen for March 10, 2026

    March 9, 2026
    Recent Comments
    • Madu on GOLD Forecast and XAU/USD Analysis for January 7, 2026
    • Enji on GOLD Forecast and XAU/USD Analysis for August 27, 2025
    • Maria Devis on Key Advantages Of Investing In Gold
    • Ramanathan on GOLD Weekly Forecast March 3 — 7, 2025
    • Nova riens on USD/JPY Forecast Japanese Yen for February 4, 2025
    Brent oil Forecast

    Brent Weekly Forecast March 9 – 13, 2026

    By forex24proMarch 7, 2026

    Brent Weekly Forecast March 9 – 13, 2026 suggests an attempt to test the resistance area near 80.45.

    EUR/USD Weekly Forecast March 9 – 13, 2026

    March 7, 2026

    GBP/USD Weekly Forecast March 9 – 13, 2026

    March 7, 2026
    FOREX24.PRO

    Free analytics FOREX. Trading signals and recommendations. Examples of transactions on the basis of forex forecasts. Quality articles about Forex. For advertising please contact us at our email

    forex24pro.manager@gmail.com

    CFDs and Forex are complex instruments and come with a high risk of losing money. You should consider whether you understand how CFDs and Forex work and whether you can afford to take the high risk of losing your money.

    Recent Posts
    • EUR/USD Forecast Euro Dollar for March 10, 2026
    • GBP/USD Forecast and Analysis for March 10, 2026
    • Australian Dollar Forecast AUD/USD for March 10, 2026
    • USD/JPY Forecast Japanese Yen for March 10, 2026
    • Brent crude oil Forecast for March 10, 2026
    Recent Comments
    • Madu on GOLD Forecast and XAU/USD Analysis for January 7, 2026
    • Enji on GOLD Forecast and XAU/USD Analysis for August 27, 2025
    • Maria Devis on Key Advantages Of Investing In Gold
    • Ramanathan on GOLD Weekly Forecast March 3 — 7, 2025

    Type above and press Enter to search. Press Esc to cancel.