
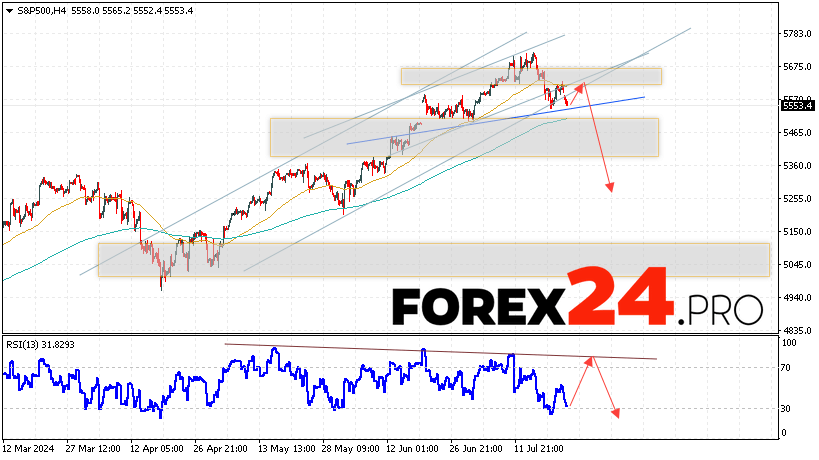
Stock index S&P 500 continue to move as part of the correction and the formation of the “Head and Shoulders” reversal pattern. Moving averages indicate a short-term bullish trend. Prices are again testing the area between the signal lines, which indicates pressure from buyers of the asset and the potential continuation of the growth of the stock index in the market from current levels. At the time of publication of the forecast, the index is trading at the level of 5553. At the moment, we can expect an attempt to develop growth and a test of the resistance level near the area of 5585. From where we can expect a rebound downward and a continuation of the fall of SP500 quotes to the area below the level of 5255.
S&P 500 Forecast and Analysis for July 25, 2024
An additional signal in favor of a fall in stock index quotes on July 25, 2024 will be a test of the resistance line on the relative strength indicator (RSI). The second signal will be a rebound from the lower border of the bullish channel. Cancellation of the option to reduce index quotes will be a strong growth and a breakdown of the 5765 area. This will indicate a breakdown of the resistance level and continued growth of SP500 index quotes with a target above the level of 6045. Expect an acceleration in the fall of stock index quotes with a breakdown of the support area and closing of quotes below the 5465 area, which will indicate a breakdown of the lower boundary of the head and shoulders reversal pattern and the beginning of a pattern with targets below.
S&P 500 Forecast and Analysis for July 25, 2024 suggests an attempt to test the resistance level near the area of 5585. Then, a continuation of the fall to the area below the level of 5255. A test of the trend line on the relative strength index (RSI) will be in favor of reducing the SP500 quotes. Cancellation of the fall option will be a strong increase in the value of the index and a breakdown of the 5765 area. This will indicate a continuation of the rise with a target near the 6045 area.