

BITCOIN BTC/USD is traded at the level of 1867. Quotes of the currency are traded below the moving average with a period of 55, which indicates a bearish trend for BITCOIN. At the moment, quotes of the pair test the lower boundary of the bands of the Bollinger Bands indicator. It is expected to test the resistance area at the level of 2000, where again we should expect an attempt to continue the fall and further develop the bearish trend for the BITCOIN cryptocurrency with the target near the level of 1720.
BITCOIN forecast & analysis BTC/USD on July 17, 2017
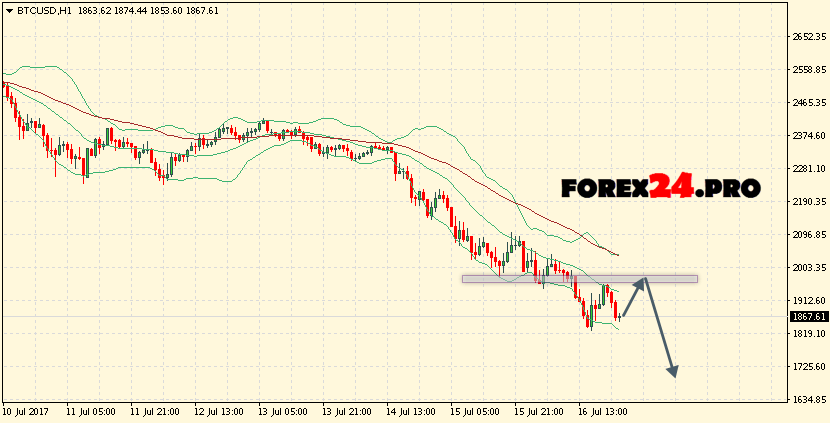
The conservative sales area for BITCOIN is located near the upper boundary of the Bollinger Bands indicator strip at 2050. Canceling the continuation of the fall BTC/USD will be a breakdown of the moving average region with level 55, as well as the upper boundary of the Bollinger Bands indicator bars and the closing of BITCOIN quotations above area 2100, indicating a trend change in favor of the bullish on BTC/USD. In the event of a breakdown of the lower border of the Bollinger Bands indicator bars, it is expected to accelerate the fall of the cryptocurrency into the area below the level of 1720.
- BITCOIN chart online
- BITCOIN forecast & analysis
- ZCASH news & technical analysis
- LITECOIN prediction for today
- RIPPLE forecast & signals