

The stock index Dow Jones is trading at 20831.1. Quotations Dow Jones are traded above the moving average with a period of 55, which indicates the existence of a bullish trend for the Dow Jones. At the moment, quotes of the stock index test the upper boundary of the bands of the indicator Bollinger Bands. A drop to the level near 20740.0 is expected, from which one should expect an attempt to continue growth with the first target near the level of 21000.0.
Bollinger Bands Dow Jones Forecast on April 6, 2017
The conservative buying area is located near the lower border of the Bollinger Bands indicator strip at 20570.0. The abolition of the option of continuing the growth of Dow Jones will be the breakdown of the lower border area, as well as the moving average and the closing of the pair’s quotes below the area of 20480.0, which indicates a change in the trend in favor of the bearish on the Dow Jones.
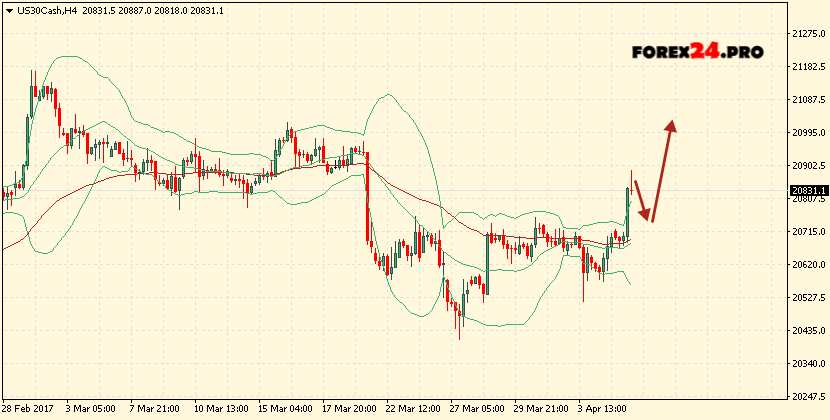
In the event of a breakdown of the upper border of the indicator strip, it is expected to accelerate the growth of the exchange index in the area above the level of 21000.0.