

The stock index Dow Jones is trading at 20439.6. Quotations Dow Jones continue to trade below the moving average with a period of 55, indicating a bearish trend for the Dow Jones. At the moment, the quotations of the exchange index are moving towards the middle border of the indicator strip Bollinger Bands. The index is expected to rise near the level of 20530.0, from which it is expected to continue the fall and further develop the bearish trend with the first target near the level of 20275.0.
Bollinger Bands forecast Dow Jones on April 21, 2017
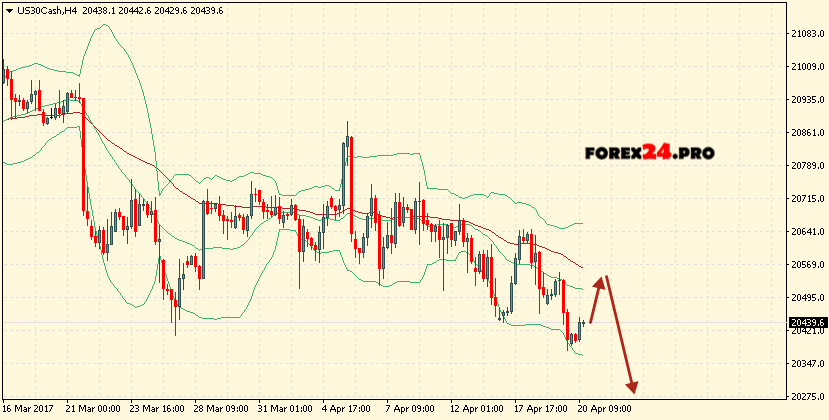
The conservative sales area is located near the upper boundary of the Bollinger Bands indicator bars at 20640.0. The cancellation of the variant of the continuation of the Dow Jones fall will be a breakdown of the moving average region with a period of 55, as well as the upper border of the indicator bands and the closing of the quotes of the index above the area of 20720.0, which indicates a change in the trend in favor of the bullish on the Dow Jones. In the event of a breakdown of the lower boundary of the indicator bands, we expect to accelerate the fall of the exchange’s index into the area below the level of 20275.0.