

The currency pair Euro Dollar EUR/USD completes the trading week at the level of 1.0616. Quotations of the pair broke through the moving average with a period of 55 and traded below its level, which indicates the presence of a bearish trend for the euro dollar. At the moment, the pair’s quotes started moving between the moving average with a period of 55 and the lower boundary of the Bollinger Bands indicator bars. It is worth waiting for an attempt to test the average border of the indicator bars and a breakdown of the moving average with a period of 55 near the level of 1.0700, where again we should expect an attempt to continue falling with the first target near the level of 1.0470.
Bollinger Bands EUR/USD prediction on April 10 — 14, 2017
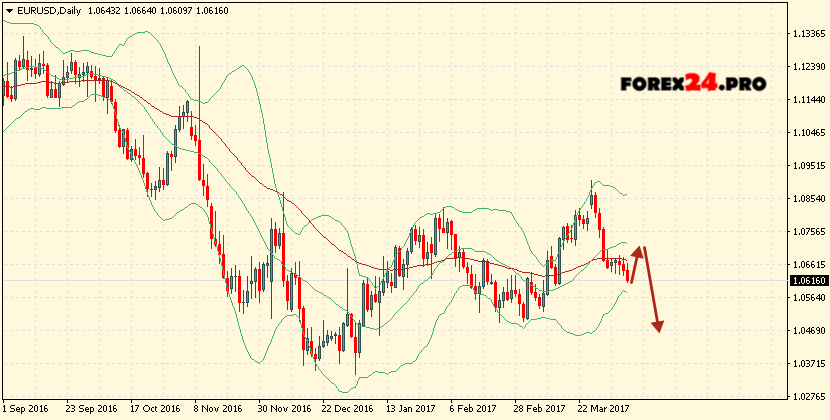
The conservative sales area is located near the upper boundary of the Bollinger Bands indicator bars at 1.0850. Canceling the option of continuing the fall of the EUR/USD pair will be the breakdown of the upper range of the indicator, as well as the moving average and the closing of the pair’s quotations above the area of 1.0950, which will indicate a change in the trend in favor of the bull on the euro dollar. In the event of a breakdown of the lower boundary of the indicator bars, it is expected to accelerate the fall of the pair into the area below the level of 1.0470.