

The stock index FTSE 100 is trading at 7372.6. Quotations on the FTSE 100 began to move above the moving average with a period of 55, which indicates the existence of a bullish trend for the FTSE 100. At the moment, the quotes of the exchange index move between the moving average with a period of 55 and the upper boundary of the indicators Bollinger Bands. It is worth waiting for an attempt to fall and the moving average test near the level of 7350, where again we should expect an attempt to continue growth with the first goal near the level of 7425.
Bollinger Bands Forecast FTSE 100 on March 30, 2017
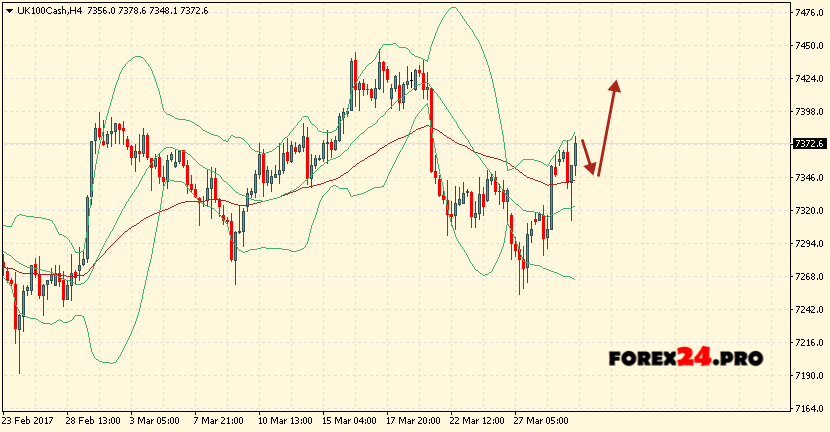
The conservative buy area is located near the lower border of the Bollinger Bands indicator strip at 7265. The abolition of the continuation of the FTSE 100 growth will be a breakdown The lower border, as well as the moving average and the closing of quotes below the area of 7245, which indicates a change in the trend in favor of the bearish on the FTSE 100. In the event of a breakdown of the upper boundary of the indicator bands, it is expected to accelerate the growth of the exchange index in the region above the level of 7425.