

The stock index FTSE 100 is trading at 7329.9. Quotations on the FTSE 100 began to move below the moving average with a period of 55, indicating a bearish trend for the FTSE 100. At the moment, the stock index moves between the moving average with a period of 55 and the lower boundary of the indicators Bollinger Bands. It is worth to expect an attempt to grow and test the mid-range of the indicator Bollinger Bands near the level of 7360.0, where again we should expect an attempt to continue falling with the first goal near the level of 7280.0.
Bollinger Bands FTSE 100 forecast on April 3, 2017
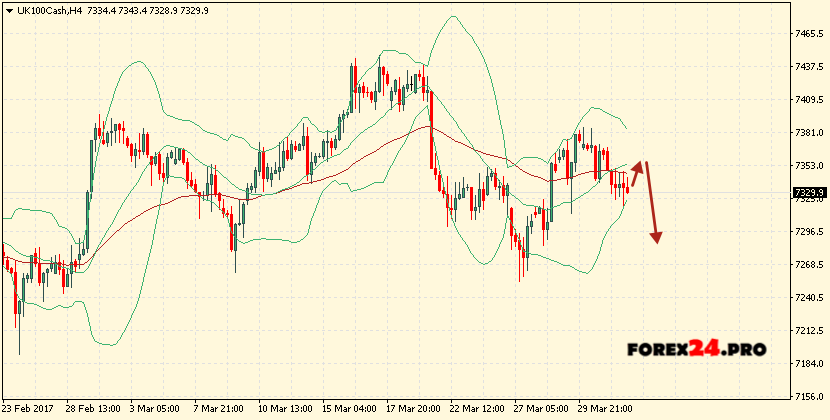
The conservative sales area is located near the upper boundary of the Bollinger Bands indicator strip at the level of 7380.0. The abolition of the continuation of the fall of the FTSE 100 will be the breakdown of the upper border area, as well as the moving average and the closing of the pair’s quotes above the 7400.0 area, indicating a change in the bullish trend for the FTSE 100. In the event of a breakdown of the lower border of the indicator bands, The area below the level of 7280.0.