

The stock index FTSE 100 is trading at 7344.2. Quotations on the FTSE 100 are trying to break through the moving average with a period of 55. At the moment, the quotes of the exchange index are moving between the middle and upper boundaries of the Bollinger Bands indicator bars, crossing the moving average with a period of 55.
It is expected to make a slight correction near the level of 7360.0, again waiting for an attempt to continue Falling with the first target near the level of 7280.0.
Bollinger Bands FTSE 100 Forecast on April 6, 2017
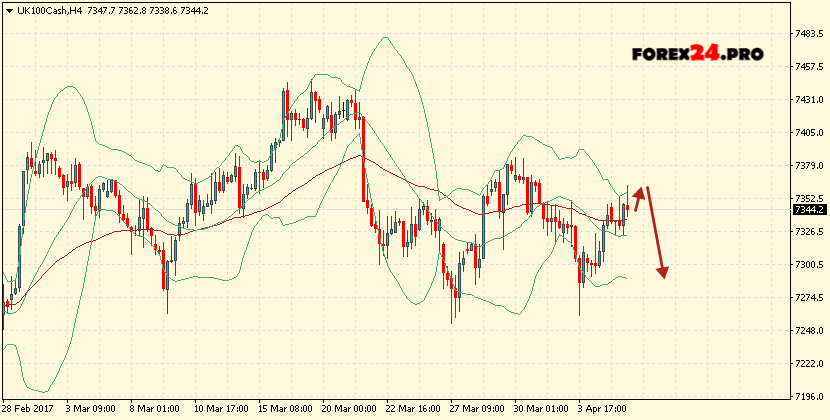
The conservative sales area is located near the upper boundary of the Bollinger Bands indicator strip at 7365.0. The abolition of the continuation of the fall of the FTSE 100 will be the breakdown of the upper border area and the closing of the quotes of the pair above the area of 7380.0, which will indicate a change in the trend in favor of the bull on the FTSE 100.
In the event of a breakdown of the lower border of the indicator bands, it is expected to accelerate the fall of the exchange index in the area below the level of 7280.0.