

The stock index FTSE 100 is trading at 7293.0. Quotations for the FTSE 100 are trading below the moving average with a period of 55, indicating a bearish trend for the FTSE 100. At the moment, stock market quotes are testing the average border of the Bollinger Bands indicator bars. It is worth expecting a slight correction near the level of 7310.0, where again we should expect an attempt to continue falling with the first target near the level of 7240.0.
Bollinger Bands FTSE 100 Forecast on April 7, 2017
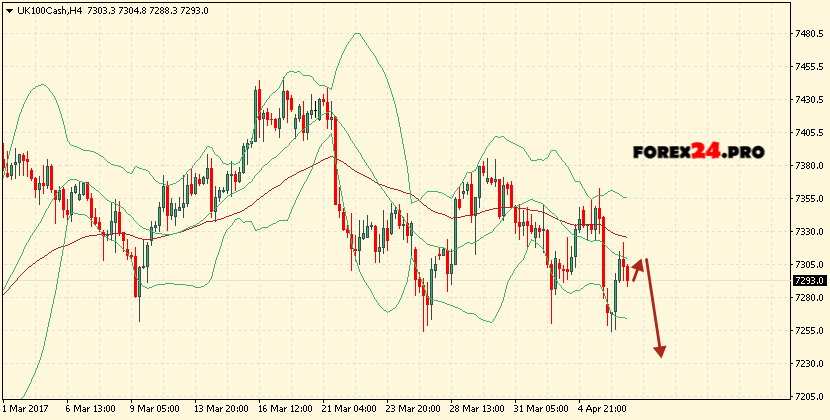
The conservative sales area is located near the upper border of the Bollinger Bands indicator strip at the level of 7350.0. The abolition of the continuation of the fall of the FTSE 100 will be the breakdown of the upper border area, as well as the moving average and the closing of the quotes of the pair above the area of 7370.0, which will indicate a change in the trend in favor of the bull on the FTSE 100. In the event of a breakdown of the lower border of the indicator bands, The area below the level of 7240.0.