

The stock index FTSE 100 is trading at 7234.4. Quotations on the FTSE 100 are traded within the boundaries of the Bollinger Bands indicator bands periodically, crossing the moving average, which indicates the presence of a lateral trend for the FTSE 100. At the moment, the stock index quotes test the average border of the Bollinger Bands indicator bars. It is worth waiting for the test of the lower boundary of the Bollinger Bands indicator bars near the level of 7195.0, from where the test of the upper border of the indicator bars near the level of 7270.0 is expected.
Bollinger Bands FTSE 100 Forecast on May 4, 2017
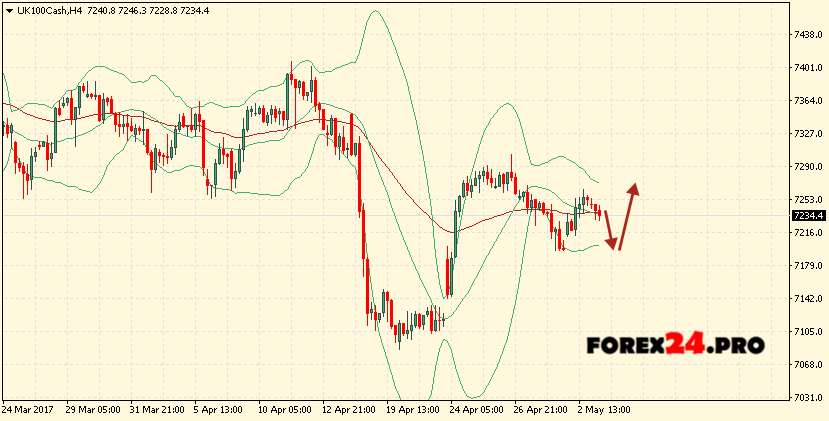
To consider selling the stock index is worthwhile with the breaking of the lower border of the indicator bands and the closing of quotes on FTSE 100 below the area of 7160, which will indicate the presence of a downward trend. With a downward trend, the conservative sales area will be located near the upper boundary of the Bollinger Bands indicator bars at 7270.0. Consider buying the exchange’s index is with a break through the upper border of the indicator bars and closing quotations on the FTSE 100 above the area of 7310, indicating that there is an upward trend. With an upward trend, the conservative shopping area will be near the lower border of the Bollinger Bands indicator strip at 7200.0.