

The stock index NASDAQ is trading at 5623.8. NASDAQ continues to trade above the moving average with a period of 55, indicating a bullish trend for the NASDAQ. At the moment, the quotations of the exchange index are moving towards the middle border of the indicator strip Bollinger Bands. It is worth waiting for an attempt to fall near the level of 5595.0, where again we should expect an attempt to continue growth with the first target near the level of 5690.0.
Bollinger Bands NASDAQ Forecast on May 4, 2017
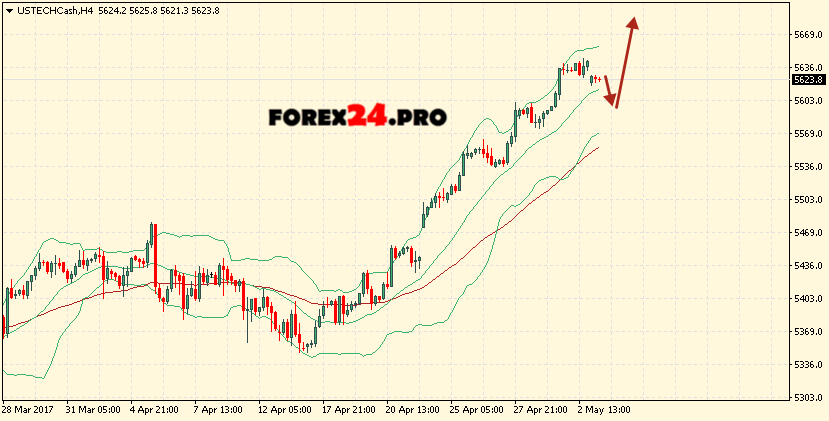
The conservative buying area is near the lower border of the Bollinger Bands indicator strip at 5570.0. Canceling the option of continuing the growth of NASDAQ will be a breakdown of the lower boundary area, as well as a moving average with a period of 55 and the closing of quotations of the exchange’s index below the area of 5520.0, which indicates a change in the trend in favor of the bearish on the NASDAQ. In the event of a breakdown of the upper border of the indicator strip, it is expected to accelerate the growth of the exchange index in the area above the level of 5690.0.