

The stock index FTSE 100 completes the trading week near the level of 7653. The index is traded inside the Ichimoku Kinko Hyo Cloud, which indicates the presence of a flat trend over the FTSE 100. The test area of Ichimoku Kinko Hyo signal lines near the level of 7485 is expected, from which it is expected to attempt a rebound and continue the development of the ascending movement for growth near the 8115 level.
FTSE 100 weekly forecast & analysis July 16 — 20, 2018
An additional signal in favor of the growth of the index in the current trading week on July 16 — 20, 2018 will test the upper boundary of the bearish channel and test the support area. Earlier, a weak signal was received for the sell of the stock index FTSE 100, due to the crossing of signal lines at the level of 7710.
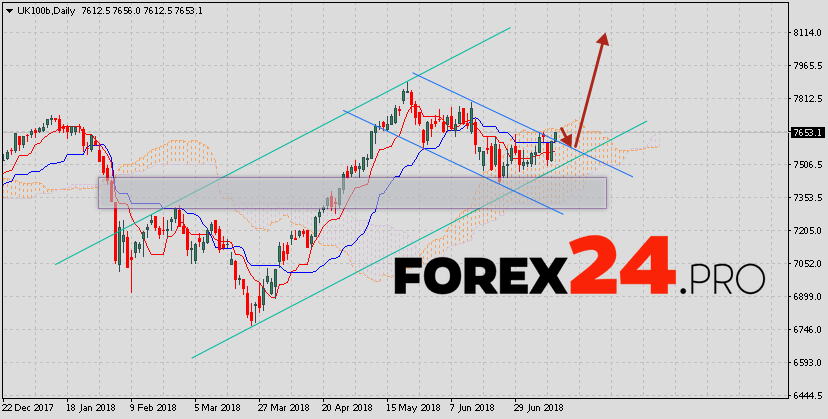
The cancellation of the growth of quotations of the stock index will be the breakdown of the upper boundary of the Ichimoku Kinko Hyo Cloud with the closing of quotations below the area of 7350, which will indicate a change in the flat trend in favor of a bearish trend and the continuation of the fall. Expect to accelerate the growth of quotations of the stock exchange index FTSE 100 and the resumption of the upward trend is due to the breakdown of the upper boundary of the Ichimoku Kinko Hyo Cloud and the closing above the level of 7750.