

The stock index FTSE 100 completes the trading week near the level of 7288. The index is trading below the lower boundary of the Ichimoku Kinko Hyo Cloud, which indicates the presence of a bearish trend. As part of the FTSE 100 weekly forecast & analysis October 8 — 12, 2018, a test of the lower boundary of the Ichimoku Kinko Hyo Cloud is expected near the 7415 level, from which one can expect an attempt to rebound and continue the downward movement development with the potential target of falling near the 6950 level.
FTSE 100 weekly forecast & analysis October 8 — 12, 2018
An additional signal in favor of reducing the index quotes in the current trading week of 8 — 12, 2018 will be the test of the upper limit of the downward channel, as well as the test of the resistance area. Earlier, a medium strength signal was received for sell of the FTSE 100 stock index, due to the crossing of signal lines at 7585.
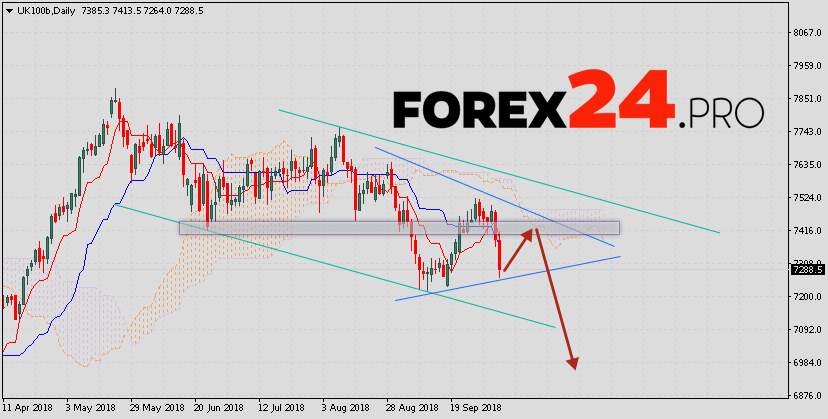
Cancellation of the option to reduce the stock index will be a breakdown of the upper limit of the Ichimoku Kinko Hyo Cloud with the closing of quotations above the 7540 area, which will indicate a change in the downward trend in favor of upward and continued growth. Expect to accelerate the fall in quotations of the stock index FTSE 100 stands with the breakdown of the lower boundary of the model «Triangle» and closing below the level of 7250.
FTSE 100 weekly forecast & analysis October 8 — 12, 2018 suggests an attempt to test the resistance level level near the 7415 area, from which we should expect a rebound and the continuation of the index quotes fall with a potential target near the 6950 level.