

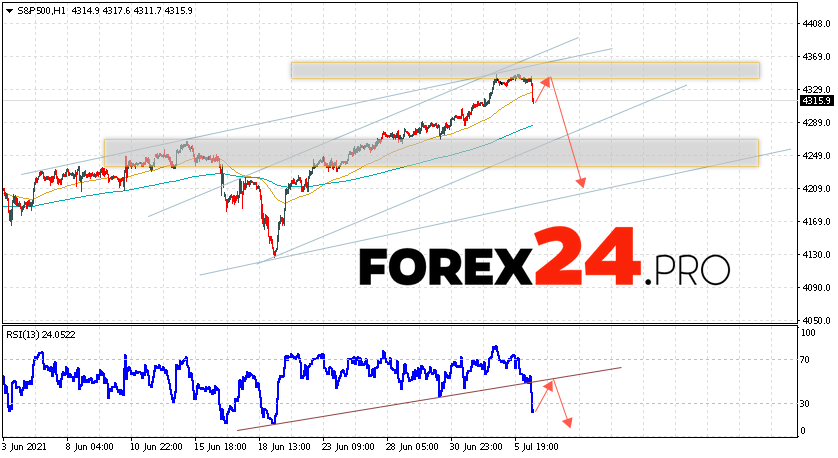
Stock index S&P 500 continue to move within the fall and the bullish channel. Moving averages indicate a short-term bullish trend. Prices are testing the area between the signal lines, which indicates pressure from buyers of the asset and a potential continuation of the rise of the stock index in the market from the current levels. At the time of the publication of the forecast, the index is trading at 4342. At the moment, we should expect an attempt to develop a rise and test the resistance level near the 4355 area. Where can we expect a rebound and the continuation of the fall in the S&P 500 quotes to the area below 4205.
S&P 500 Forecast and Analysis July 7, 2021
An additional signal in favor of falling stock index quotes will be a test of the resistance line on the relative strength index (RSI). The second signal will be a rebound from the resistance area on the price chart. Cancellation of the option of falling index quotes will be a strong growth and a breakdown of the area of 4370. This will indicate a breakdown of the resistance level and a continued rise in the S&P 500 index with a target above the level of 4655. Expect an acceleration of the fall in stock index quotes with the breakdown of the support area and closing of quotations below the 4205 area.
S&P 500 Forecast and Analysis July 7, 2021 suggests an attempt to test the resistance level near the 4355 area. Then, the continuation of the fall to the area below 4205. In favor of reducing the S&P 500 quotes, a test of the trend line on the relative strength index (RSI) will come out. Cancellation of the fall option will be a strong growth in the value of the index and a breakdown of the 4370 area. This will indicate a continued rise with a target above the 4655 area.