

The stock index S&P 500 completes the trading week near the level of 2800. The index is trading above the upper boundary of the Ichimoku Kinko Hyo Cloud, indicating a bullish trend in the S&P 500. The Ichimoku Kinko Hyo Cloud upper limit test is expected near the level of 2755, from which it is expected to attempt a rebound and continue development of the bull tendency with the target of growth near the level of 2920.
S&P 500 weekly forecast & analysis July 16 — 20, 2018
An additional signal in favor of the growth of the index in the current trading week on July 16 — 20, 2018 will test the upper limit of the «Triangle» model, as well as the test of the support area. Earlier, a strong signal was received for the buy of the stock index S&P 500, due to the crossing of the signal lines at the level of 2730.
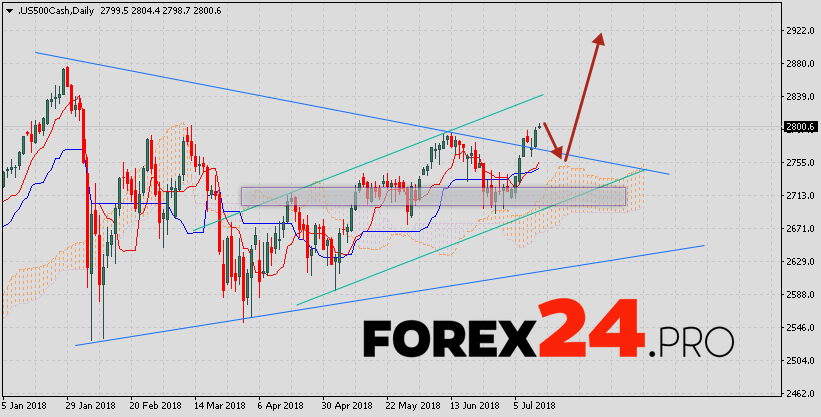
The cancellation of the growth of the quotations of the index will be the breakdown of the lower boundary of the Cloud of Ichimoku Kinko Hyo with the closing of quotes below the area of 2670, which will indicate a change in the bullish trend in favor of the bearish trend and the continuation of the fall. Expect to accelerate the growth of quotations of the stock exchange index S&P 500 is with the breakdown of the resistance area and the closing above the level of 2920.