

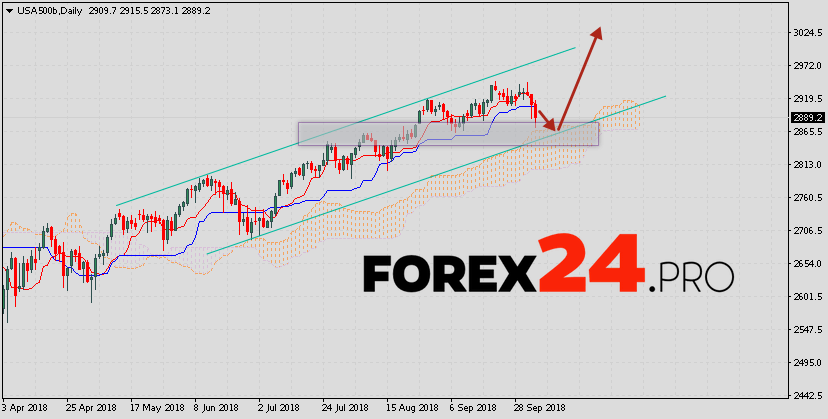
The stock index S&P 500 ends the trading week near the 2889 level. The index is trading above the upper limit of the Ichimoku Kinko Hyo Cloud, which indicates an uptrend. As part of S&P 500 weekly forecast & analysis October 8 — 12, 2018, a test of the upper limit of the Ichimoku Kinko Hyo Cloud is expected near the level of 2865, from which one can expect an attempt to rebound and continue the development of the bull trend with the target of growth near the level of 3025.
S&P 500 weekly forecast & analysis October 8 — 12, 2018
An additional signal in favor of the growth of quotations of the index in the current trading week of 8 — 12, 2018 will be a test of the support area, as well as a rebound from the lower boundary of the rising channel. Previously, a strong signal was received for buy of the S&P 500 stock index, due to the crossing of signal lines at the level of 2745.
Cancellation of the growth of quotations of the stock index will be a breakdown of the lower boundary of the Ichimoku Kinko Hyo Cloud with the closing of quotations below the 2800 region, which will indicate a change in the upward trend in favor of a downward trend and a further decline. Expect acceleration of growth of quotations of the stock index S&P 500 stands with the breakdown of the resistance area and closing above the level of 2980.
S&P 500 weekly forecast & analysis October 8 — 12, 2018 implies an attempt to test the support level near the 2865 area, from which we can expect a rebound and continued growth of the index quotes with a potential target near the level of 3025.