

Stock index NASDAQ is trading at 5615.5. NASDAQ is trading above the upper boundary of the Ichimoku Kinko Hyo Cloud, indicating an bullish trend in the NASDAQ. A test of the area of signal lines near the level 5645.0 is expected, followed by a test of the lower boundary of the Ichimoku Kinko Hyo Cloud near the level 5615.0, from which one should expect an attempt to grow and the bullish trend at the Stock index NASDAQ near the level 5730.0.
Technical analysis & forecast NASDAQ on May 19, 2017
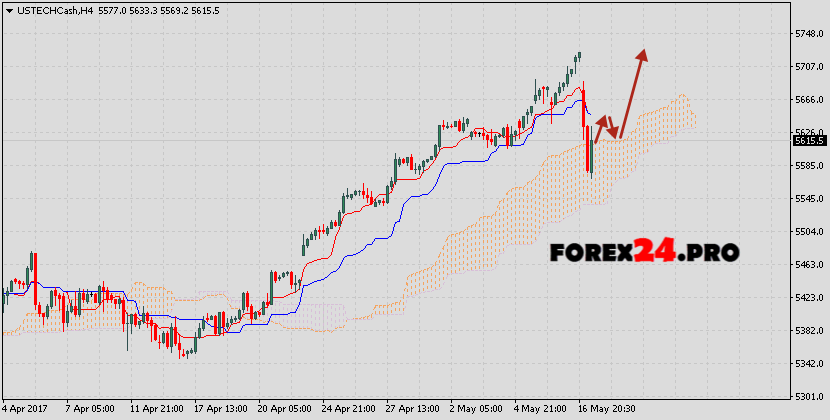
Earlier, a weak signal was received for the buy of the Stock index NASDAQ, due to the crossing of the signal lines at the level of 5379.0. The cancellation of the growth of quotations of the stock index will be the breakdown of the lower boundary of the Cloud of Ichimoku Kinko Hyo with the closing of quotations below the area of 5600.0, which will indicate a change in the bullish trend in favor of the bearish trend. Expect the acceleration of the growth of quotations of the NASDAQ stock index, with the breakdown of the local maximum area at the level of 5700.0.