

The currency pair New Zealand dollar to US Dollar NZD/USD completes the trading week at 0.6961. The pair is trading below the moving average with a period of 55, indicating a bearish trend for the New Zealand dollar dollar. At the moment, quotes of the pair move between the lower and middle boundaries of the bands of the indicator Bollinger Bands. It is worth waiting for the test of the average border of the Bollinger Bands indicator bars near the level of 0.7020, where we can expect an attempt to continue the fall with the first target near the level of 0.6850.
Bollinger Bands NZD/USD prediction on April 10 — 14, 2017
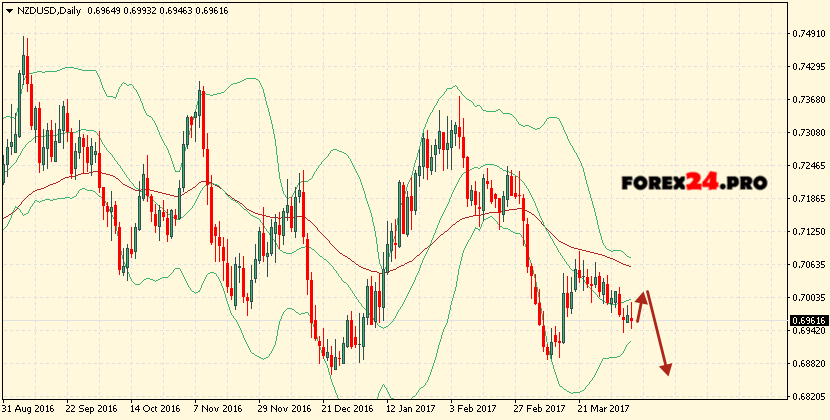
The conservative sales area is located near the upper boundary of the Bollinger Bands indicator bars at 0.7060. The abolition of the continuation of the fall of the NZD/USD pair will be the breakdown of the upper border area, as well as the moving average and the closing of the pair’s quotations above the area of 0.7120, indicating a change in the trend in favor of the bullish pair of the New Zealand Dollar. In the event of a breakdown of the lower boundary of the indicator bands, it is expected to accelerate the fall of the pair into the area below the level of 0.6850.