

Currency pair New Zealand Dollar to US Dollar NZD/USD completes the trading week at 0.6924. The pair is trading below the moving average with a period of 55, indicating a bearish trend for the New Zealand Dollar to US Dollar. At the moment, quotes of the pair test the average border of the indicator Bollinger Bands. It is worth expecting a correction to the moving average with a period of 55 near the level of 0.6970, where we can expect an attempt to continue falling quotes of the pair and further development of the bearish trend for NZD/USD with the first target near the level 0.6740.
Forex forecast NZD/USD on May 22 — 26, 2017
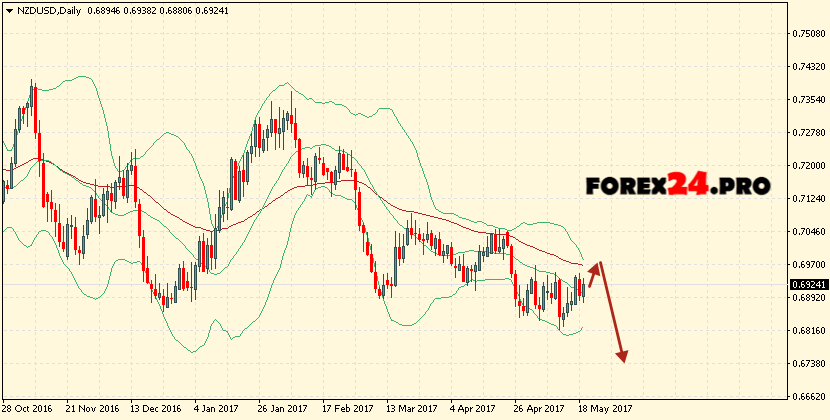
The conservative sales area is located near the upper boundary of the Bollinger Bands indicator at 0.6990. The cancellation of the continuation of the fall of the pair NZD/USD will be a breakdown of the moving average region with a period of 55, as well as the upper boundary of the Bollinger Bands indicator and the closing of the pair’s quotes above the 0.7050 area, which indicates a change in the trend in favor of the bullish on the New Zealand Dollar to US Dollar NZD/USD. In the event of a breakdown of the lower boundary of the Bollinger Bands, it is expected to accelerate the fall of the pair into the area below the level of 0.6740.