

RIPPLE XRP/USD is trading at the level of 0.2338. Quotes of the currency are traded below the moving average with a period of 55, which indicates the presence of a downward trend for RIPPLE. At the moment, quotes are testing the lower boundary of the bands of the Bollinger Bands indicator. It is expected to test the average border at 0.2500, where again we should expect an attempt to fall from a drop in growth near the level of 0.2065.
RIPPLE forecast & analysis XRP/USD on July 8, 2017
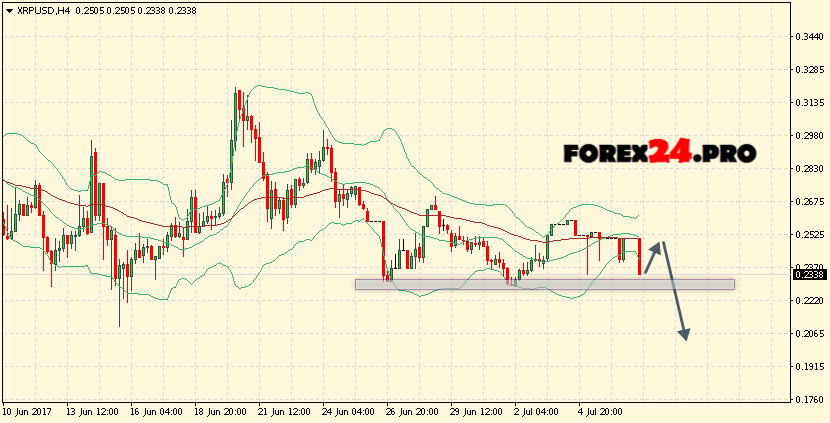
Conservative sales area RIPPLE is located near the upper boundary of the Bollinger Bands indicator bars at 0.2065. The abolition of the option of continuing the fall of the XRP/USD cryptocurrency will be a breakdown of the moving average region with a level of 55, as well as the upper boundary of the Bollinger Bands indicator bars and the closing of the RIPPLE quotes above the area of 0.2680, indicating a change in the bullish trend for XRP/USD. In the event of a breakdown of the lower boundary of the Bollinger Bands indicator bars, it is expected to accelerate the fall of the cryptocurrency into the area below the level of 0.2065. An additional signal will be a breakdown of the support area.
- BITCOIN chart online
- BITCOIN forecast & analysis
- ZCASH news & technical analysis
- LITECOIN prediction for today
- RIPPLE forecast & signals
1 Comment
get ready to Invest in Ripple,it conttinue to fall ” it’s expect to accelerate the fall” into area below the level 0.2065, for a long _term good to Invest .it will kick back by the third weeks of July ….make you little profit..