

Stock index S&P 500 is trading at the level of 2324.6. The S&P 500 continues to move below the moving average level with a period of 55, which indicates a bearish trend for the S&P500. At the moment, stock market quotes are testing the lower boundary of the Bollinger Bands indicator bars. It is worth waiting for an attempt to grow and test the middle border of the bands near the level of 2335.0, where again we should expect an attempt to continue falling with the first goal near the level of 2300.0.
Bollinger Bands forecast S&P500 on March 28, 2017
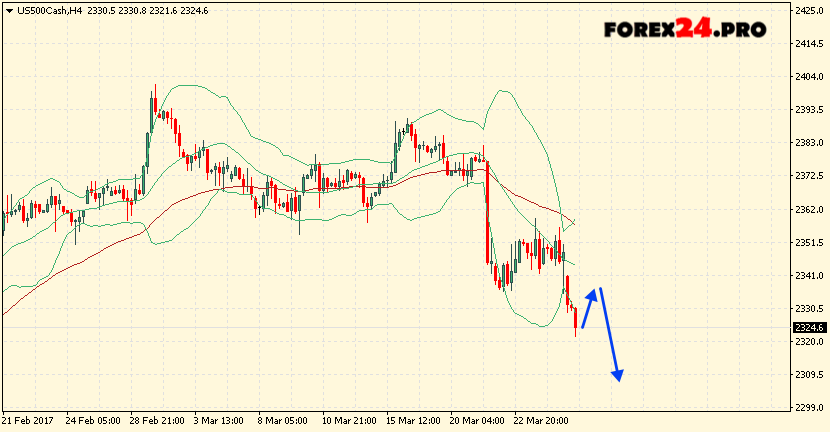
The conservative sales area is located near the upper boundary of the Bollinger Bands indicator bars at 2356.0. The abolition of the continuation of the fall of the S & P 500 will be the breakdown of the upper border area, as well as the moving average and the closing of the pair’s quotes above the area of 2362.0, indicating a change in the bullish trend for the S&P 500. In the event of a breakdown of the lower border of the indicator bands, the area below the level of 2300.0.