

Stock index S&P 500 is trading at the level of 2347.4. The S&P 500 is trading below the moving average with a period of 55, indicating a bearish trend for the S&P 500. At the moment, stock market quotes are testing a moving average with a period of 55. It is worth waiting for an attempt of a minor correction near the level of 2352.0, where again we should expect an attempt to continue falling and develop a bearish trend for the S&P 500 with the first target near the level of 2330.0.
Bollinger Bands S&P 500 forecast on April 20, 2017
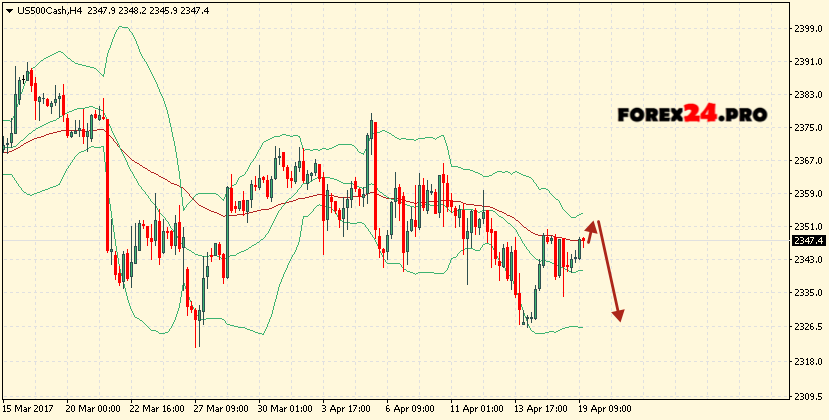
The conservative sales area is located near the upper boundary of the Bollinger Bands indicator bars at 2355.0. The abolition of the continuation of the fall of the S&P 500 will be a breakdown of the upper border area, as well as a moving average with a period of 55 and the closing of quotes of the pair above the area of 2363.0, indicating a change in the trend in favor of the bullish on the S&P 500. In the event of a breakdown of the lower boundary of the indicator bands, it is expected to accelerate the fall of the exchange index in the area below the level of 2330.0.