

The stock index S&P500 is trading at the level of 2372.9. The S&P500 is trading above the moving average with a period of 55, indicating a bullish trend for the S&P500. At the moment, quotes of the stock index test the upper boundary of the bands of the indicator Bollinger Bands.
It is worth waiting for an attempt to drop and test the middle border of the Bollinger Bands indicator bars near the level of 2360.0, where again we should expect an attempt to continue growth with the first goal near the level of 2390.0.
Bollinger Bands S&P500 Forecast on April 6, 2017
The conservative buying area is located near the lower border of the Bollinger Bands indicator strip at the level of 2350.0. The abolition of the continuation of the growth of the S&P500 will be the breakdown of the lower boundary area, as well as the moving average and the closing of quotes of the pair below the area of 2340.0, which will indicate a change in the trend in favor of the bearish S&P500.
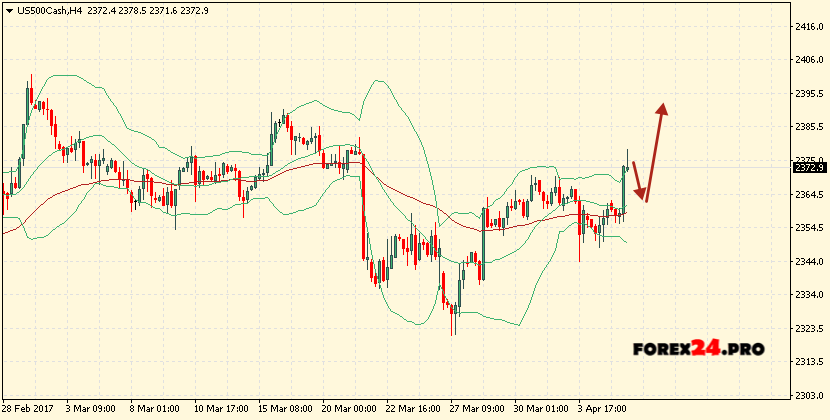
In the event of a breakdown of the upper boundary of the indicator bands, it is expected to accelerate the growth of the exchange index in the area above the level of 2390.0.