

Quotes S&P 500 stock index trading at 2381.5. The index continues to move near the top of the indicator strips, and much above the moving average with a period of 55, suggesting a bullish trend on the index.
At the moment, we can expect an attempt to slight correction to the middle Bollinger Bands indicator strips line near the level of 2340, where once again we can expect attempts of growth in the area above the level of 2450.
Forecast S&P 500 on March 6, 2017 — March 10, 2017
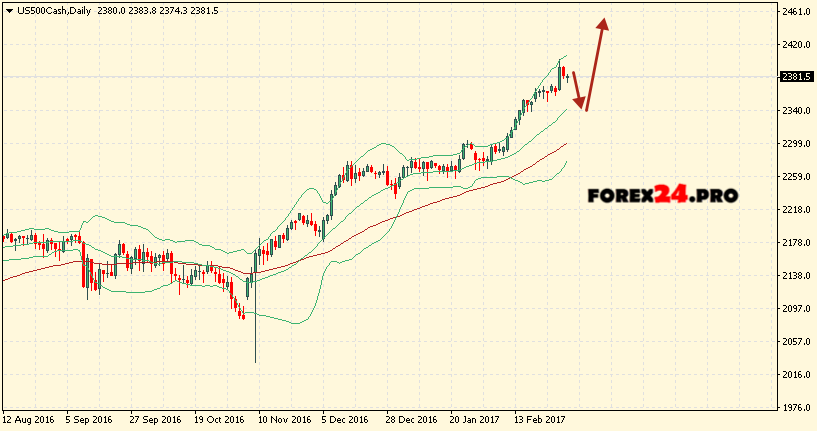
The conservative area to buy S&P 500 index is at a level lower bands near the region of 2270. Breakdown this area will indicate the likely change in favor of a bearish trend for the index. In the case of the breakdown region of the upper border of the indicator is expected to accelerate the growth of S&P 500 stock.