

The currency pair US Dollar to Swiss Franc USD/CHF is trading at 0.9907. The pair is trading below the moving average with a period of 55, indicating a bearish trend for the US Dollar Frank. At the moment, quotes of the pair test the lower boundary of the bands of the Bollinger Bands indicator. A test of the average border of the Bollinger Bands indicator bars near the level of 0.9930 is expected, where again we should expect an attempt to continue falling with the first target near the level of 0.9880.
Bollinger Bands USD/CHF Forecast on May 4, 2017
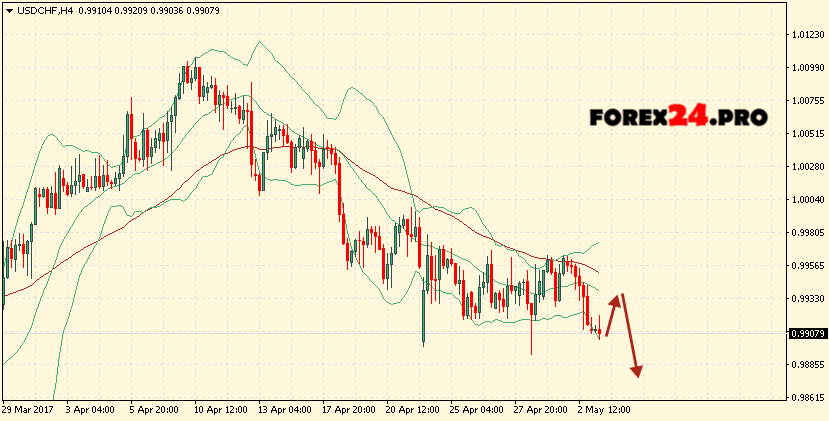
The conservative sales area is located near the upper boundary of the Bollinger Bands indicator bars at 0.9970. The abolition of the continuation of the fall of the pair The US Dollar will be a breakdown of the moving average region with a period of 55, as well as the upper border of the indicator bars and the closing of the pair’s quotes above 1.0000 area, indicating a change in the bullish trend for USD/CHF. In the event of a breakdown of the lower border of the indicator strip, we expect to accelerate the fall of the pair into the area below the level of 0.9880.