

The currency pair US Dollar to Japanese Yen USD/JPY is trading at 110.739. The pair is trading below the moving average with a period of 55, indicating a bearish trend for the US dollar. At the moment, quotes of the pair test the average border of the bars of the indicator Bollinger Bands. It is worth waiting for an attempt to continue the fall with the first goal near the level of 109.400.
Bollinger Bands USD/JPY Forecast on April 7, 2017
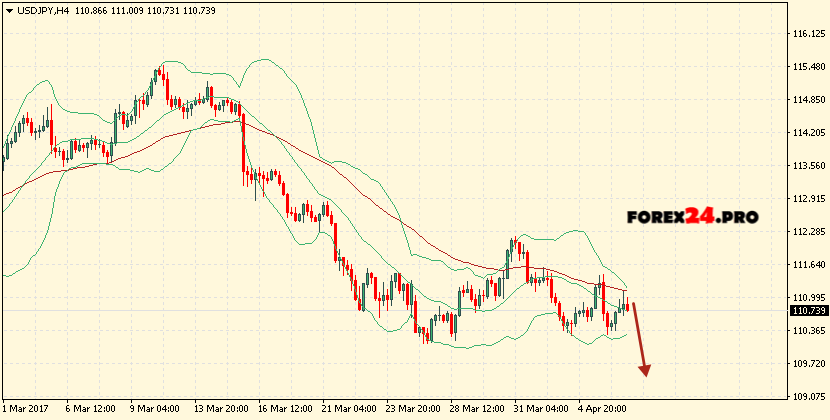
The conservative sales area is located near the upper boundary of the Bollinger Bands indicator bars at 111.100. The abolition of the continuation of the fall of the US dollar pair Yen will be a breakdown of the upper border area, as well as the moving average and the closing of the pair’s quotes above the area of 111.600, indicating a change in the bullish trend for USD/JPY. In the event of a breakdown of the lower boundary of the indicator bands, it is expected to accelerate the fall of the pair into the area below the level of 109.400.