

The currency pair US Dollar to Japanese Yen USD/JPY is trading at 112.155. The pair is trading above the moving average with a period of 55, indicating a bullish trend for the US Dollar to Yen. At the moment, the pair quotes are moving towards the middle border of the Bollinger Bands indicator bars. The test of the average border of the Bollinger Bands indicator bars near the level of 111.690 is expected, from which one should expect an attempt to continue the growth and further development of the upward trend in the US Dollar Yen with the first target near the 112.800 level.
Bollinger Bands USD/JPY Forecast on May 4, 2017
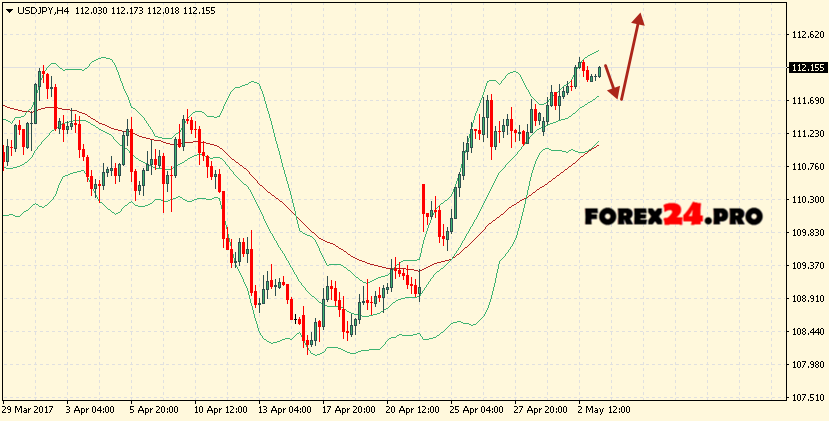
The conservative buying area is near the lower border of the Bollinger Bands indicator strip at 111.100. Canceling the option of continuing the growth of the US dollar pair Yen will be a breakdown of the lower border of the indicator bands, as well as a moving average with a period of 55 and the closing of the pair’s quotes below the 110.600 area, indicating a change in the bearish trend for USD/JPY. In the event of a breakdown of the upper border of the indicator strip, it is expected to accelerate the growth of the pair in the area above the level of 112.800.