

Currency pair US Dollar to Japanese Yen USD/JPY is trading at 113.441. The pair is trading above the moving average with a period of 55, which indicates the existence of a bullish trend for the pair US Dollar to Japanese Yen. At the moment, the pair’s quotes are moving near the middle border of the Bollinger Bands indicator bars. The test of the lower border of the Bollinger Bands indicator near the level of 113.200 is expected, from which one should expect an attempt to continue growth and further development of the upward trend in the pair US Dollar to Japanese Yen with the first target near the level of 114.900.
Technical analysis & prediction USD/JPY on May 16, 2017
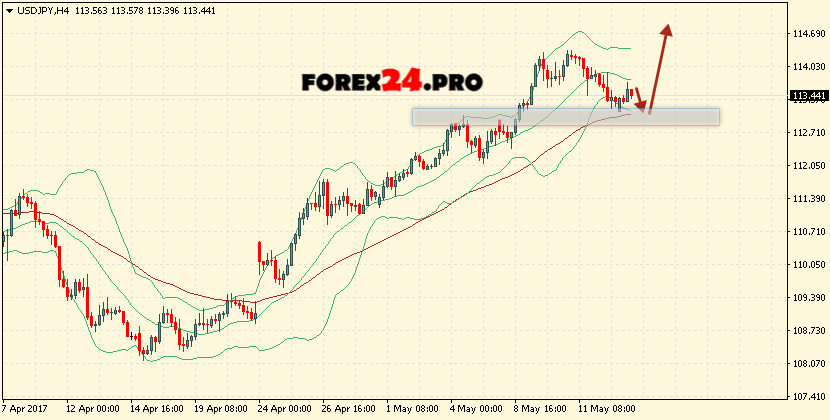
An additional signal in favor of the growth of the pair is the support area test. The conservative USD/JPY buy area is near the lower border of the Bollinger Bands indicator bars at 113.200. The cancellation of the continuation of the growth of the pair US Dollar to Japanese Yen will be a breakdown of the lower border area of the indicator bands, as well as a moving average with a period of 55 and the closing of the pair’s quotes below the 112.300 area, indicating a change in the bearish trend for USD/JPY. In the event of a breakdown of the upper boundary of the indicator bands, it is expected to accelerate the growth of the pair to an area above the level of 114.900.