
 technical analysis April 13, 2018")
Bitcoin BTC/USD are traded at 6815 and continue to move in a bearish trend. At this point, we should expect an attempt to test the upper limit of the model «Triangle» near area 6900. Where again we should expect a rebound and an attempt to continue falling Bitcoin with a target below the level of 5800.
Bitcoin (BTC/USD) technical analysis April 13, 2018
In favor of falling quotations of BTC/USD will test the trend line on the indicator of relative strength index (RSI), as well as the formation of the reversal model «Head and Shoulders» on the chart of the indicator. The cancellation of the Bitcoin drop option will result in a strong growth and breakdown of the 7200 area, which will indicate the breakdown of the upper limit of the «Triangle» model and the continuation of the growth above the level of 9100. A breakdown of the support area and closing below the level of 6400 will confirm the development of the bearish trend.
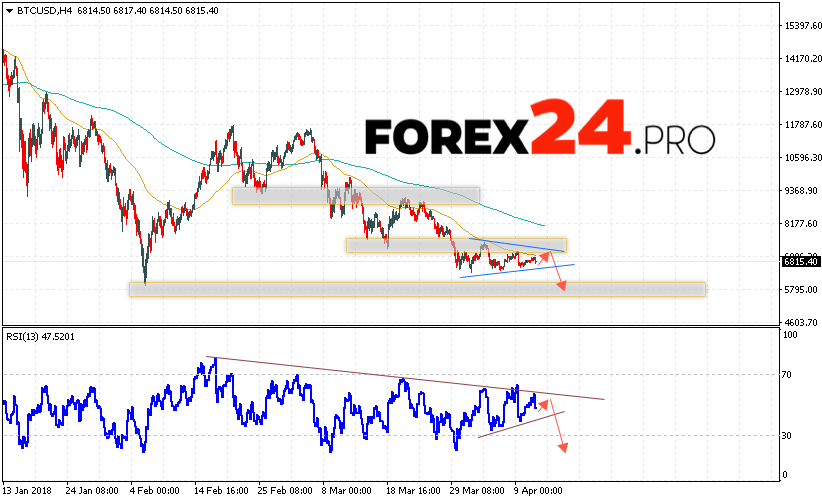
Bitcoin (BTC/USD) technical analysis April 13, 2018 suggests a test of the resistance line near the area of 6900 and the continuation of the fall with a potential target at 5800, an additional signal in favor of the Bitcoin drop will be a trend line test on the relative strength index (RSI).