




Ethereum is ending the trading week with a correction. The ETHUSD price is trading near 1923. Moving averages indicate a bearish trend for ETH/USD. Prices are again testing the area between the signal lines, indicating growing selling pressure and a potential continuation of the decline from current levels. At this point, we should expect an attempt at a bullish price correction and a test of the resistance level near 2065. From here, we should expect another downward rebound and a continued decline in the Ethereum price and exchange rate, with a potential target below 705 as part of the weekly price forecast.
Ethereum Forecast ETH/USD August 10 – 14, 2026
An additional signal favoring a decline in ETH/USD quotes during the current trading week (August 10-14, 2026) will be a test of the descending resistance line on the relative strength indicator. The second signal will be a rebound from the upper boundary of the bearish channel. A strong rally and a breakout of 2445 would cancel out the downward trend in the cryptocurrency this trading week. This would indicate a breakout of the resistance area and continued growth in ETH/USD quotes, with a potential target above 3605. A decline in Ethereum would be confirmed by a breakout of the support area and a close below 1775, indicating a breakout of the local support level.
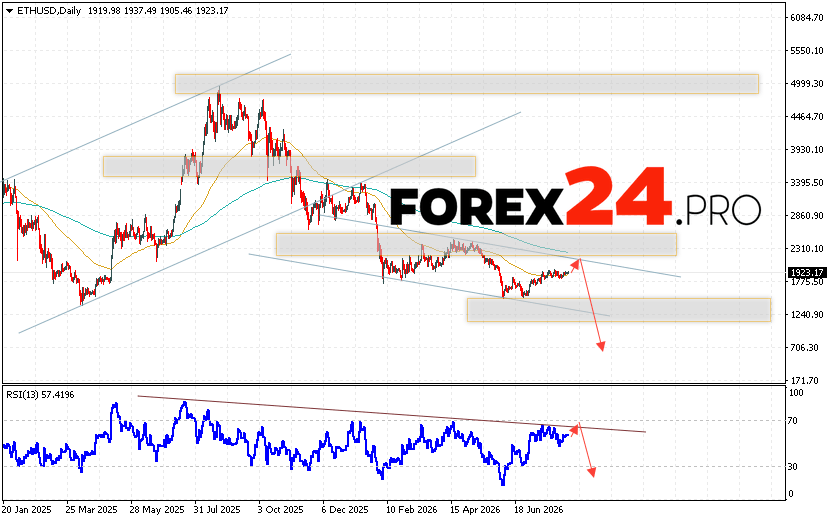
Ethereum Forecast ETHUSD August 10 – 14, 2026 suggests an attempt to develop a bullish correction and test the resistance area near 2065. From there, a downward rebound and continued decline in the cryptocurrency to below 705 should be expected. A test of the trend line on the relative strength indicator (RSI) would be an additional signal of a decline in the Ethereum price. A strong rally and a breakout of the 2445 area would cancel the downward scenario. In this case, we should expect continued growth with a target above the 3605 area.
