
 technical analysis August 16, 2018")
Bitcoin BTC/USD are traded at the level of 6316 and continue to move within the framework of the bullish correction. At this point, we should expect a test of the resistance level near the area of 6550. Again, we should expect a rebound and an attempt to continue the fall of the Bitcoin exchange rate with a target below the level of 5400.
Bitcoin (BTC/USD) technical analysis August 16, 2018
In favor of lower quotations BTC/USD will test the resistance area on the indicator of relative strength index (RSI). The abolition of the Bitcoin growth option will be the fall and breakdown of the area 6850, which will indicate the breakdown of the resistance area and the continued growth of the Bitcoin exchange rate. With the breakdown of the support area and the closing of the quotes of the cryptocurrency below the level of 5850, one should expect confirmation of the development of the fall variant.
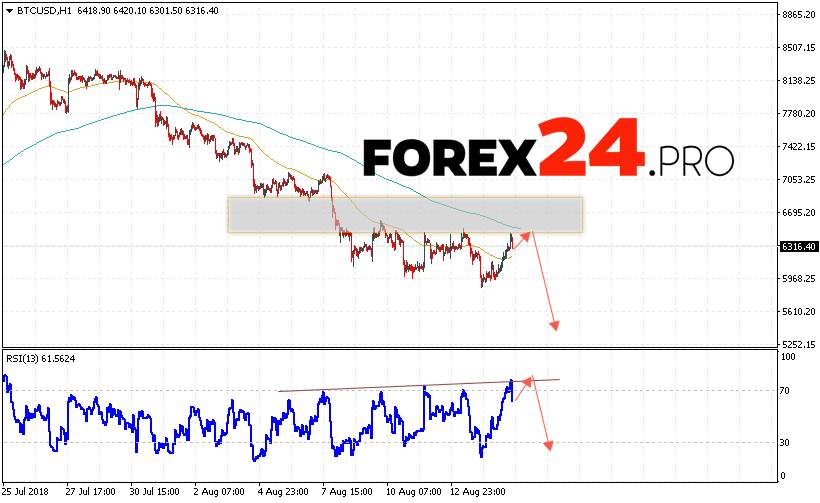
Bitcoin (BTC/USD) technical analysis August 16, 2018 suggests a test of the resistance level near the area of 6550 and the continuation of the fall of the cryptocurrency with a potential target at 5400, an additional signal in favor of Bitcoin depreciation will be a test of the resistance area on the indicator of relative strength index (RSI).