
 technical analysis on March 21, 2018")
Bitcoin BTC/USD are traded at 8475 and continue to move in a bearish trend. At this point, we should expect a test of the resistance area near the 8600 level. Again, we should expect a rebound and an attempt to continue the Bitcoin drop below 7200 level.
Bitcoin (BTC/USD) technical analysis on March 21, 2018
In favor of falling quotes BTC/USD will test the trend line on the indicator of relative strength. Abolishing the growth of Bitcoin decline will be a strong growth and breakdown of the 8900 area, which will indicate the breakdown of the upper boundary of the bearish channel and the continuation of growth above the level of 10300, within the bull model of the «Wolfe Wave». Confirmation of the development of a bearish trend will be the breakdown of the support area and the closure below the level of 8500.
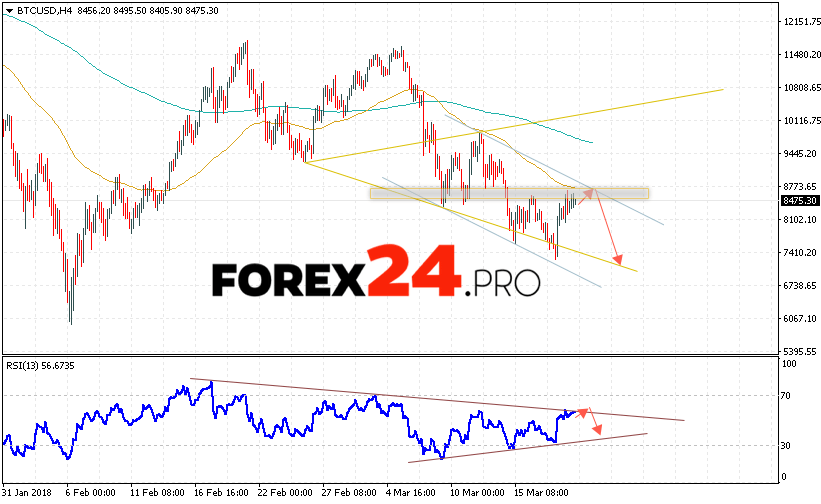
Bitcoin (BTC/USD) technical analysis on March 21, 2018 suggests an attempt to test the resistance area near the 8600 level and continue falling with a potential target at 7200, an additional signal in favor of the Bitcoin drop will be a trend line test on the indicator of relative strength index (RSI).