

Bitcoin BTC/USD completes the trading week at 6503 and continues to move within the framework of the formation of the «Triangle» model. At this point, we should expect a test of the resistance area near the level of 7100. Again, we should expect a rebound and an attempt to continue the fall of the Bitcoin exchange rate with a potential target below the level of 4350.
Bitcoin weekly forecast & analysis August 27 — 31, 2018
In favor of lowering the quotations of BTC/USD on the current trading week on August 27 — 31, 2018, a test of the broken trend line will be made on the indicator of relative strength index (RSI). The abolition of Bitcoin’s fall will be a strong growth and breakdown of the 7950 area, which will indicate the breakdown of the upper bound of the «Triangle» model and the continuation of the growth of BTC/USD above the level of 9500. Confirmation of the fall will be the breakdown of the lower bound of the «Triangle» model and the closing of quotes below the level of 5500.
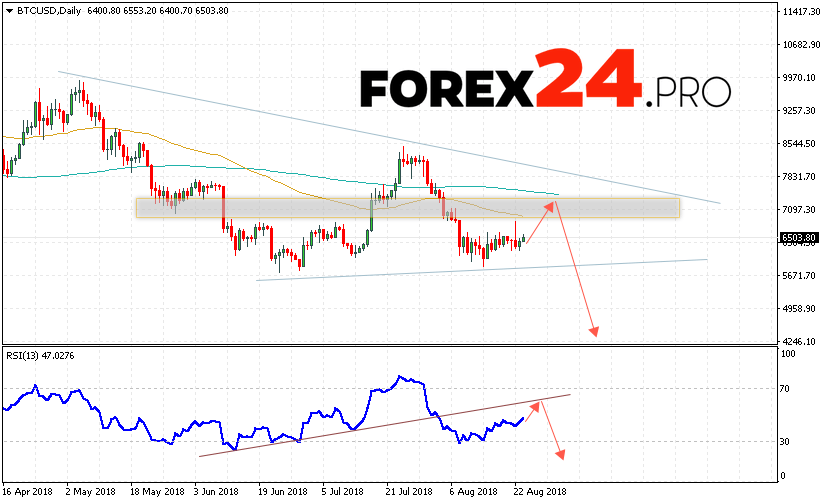
Bitcoin weekly forecast & analysis August 27 — 31, 2018 suggests an attempt of a resistance area near the level of 7100 and continuation of the fall of the cryptocurrency in the area below the level of 4350, an additional signal in favor of Bitcoin depreciation will be a trend line test on the relative strength index (RSI).