

Bitcoin BTC/USD completes the trading week at 6414 and continues to move within the framework of the formation of the «Triangle» model. At this point, we should expect a test of the resistance area near the level of 7050. Again, we should expect a rebound and an attempt to continue the fall of the Bitcoin exchange rate with a potential target below the level of 5050.
Bitcoin weekly forecast & analysis September 17 — 21, 2018
In favor of the decline in BTC/USD quotations on the current trading week on September 17 — 21, 2018, a resistance line test will be performed on the relative strength index (RSI), as well as the upper bound of the «Triangle» model. The abolition of the Bitcoin fall will be a strong growth and breakdown of the area of 7550, which will indicate the breakdown of the upper boundary of the model and the continuation of the growth of BTC/USD with a potential target above 9500. Confirmation of the downward trend will break through the bottom of the «Triangle» and close quotes below 580.
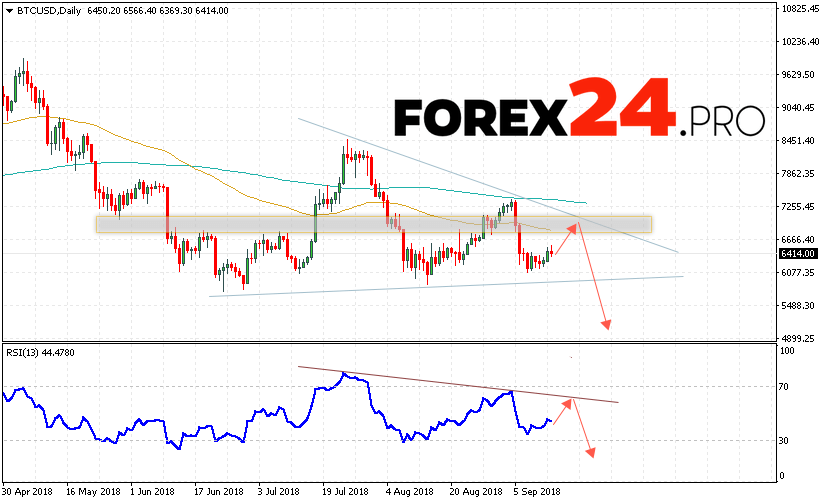
Bitcoin weekly forecast & analysis September 17 — 21, 2018 suggests the attempt of the resistance area near the level of 7050 and the continuation of the fall of the cryptocurrency in the area below the level of 5050, an additional signal in favor of Bitcoin depreciation will be a test of the resistance area on the indicator of relative strength index (RSI).