
 technical analysis August 16, 2018")
Ethereum ETH/USD are traded at 279 and continue to move within the bearish channel. At this point, we should expect an attempt to test the upper border of the channel near area 295. Where again we should expect a rebound and the continued fall of the Ethereum rate with a target below the level of 195.
Ethereum (ETH/USD) technical analysis August 16, 2018
In favor of falling quotations ETH/USD will test the trend line on the indicator of relative strength index (RSI). Cancellation of the variant of the cryptocurrency fall will be a strong growth and breakdown of the level of 300, which will indicate the breakdown of the upper border of the channel and the continuation of the growth of ETH/USD above the level of 380. With the breakdown of the support area and the closing of quotes below 225, it is necessary to confirm the development of a bearish trend in Ethereum.
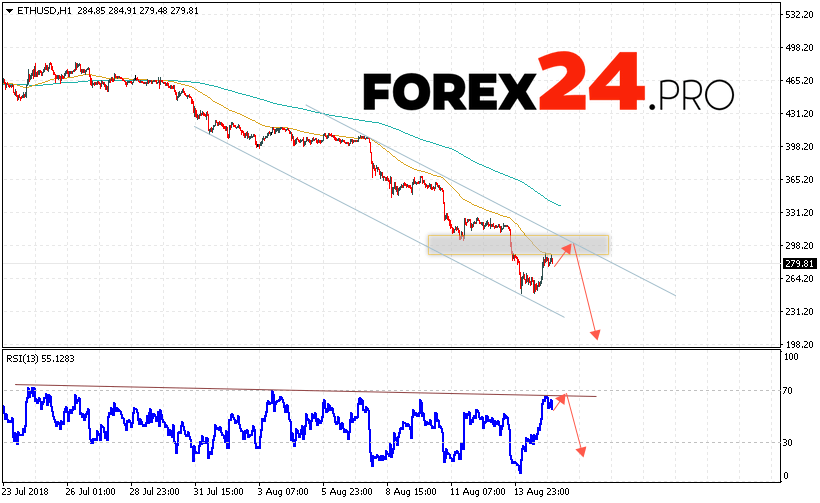
Ethereum (ETH/USD) technical analysis August 16, 2018 suggests an attempt to test the resistance area near the level of 295, from which it is expected to rebound and continue decreasing the ETH/USD cryptocurrency in the area below the 195 level, an additional signal in favor of the Ethereum fall will be a trend line test on indicator of relative strength index (RSI).