

Cryptocurrency ETHEREUM ETH/USD is trading at 253.76. Quotes of the currency are traded below the moving average with a period of 55, which indicates a bearish trend for ETHEREUM. At the moment, quotations ETHEREUM test the lower boundary of the bands of the indicator Bollinger Bands. It is expected that the quotations will increase to the moving average at 285, where again we should expect an attempt to continue the fall and further develop the bearish trend in the ETHEREUM cryptocurrency to fall near the level of 205.
ETHEREUM forecast & analysis ETH/USD on July 2, 2017
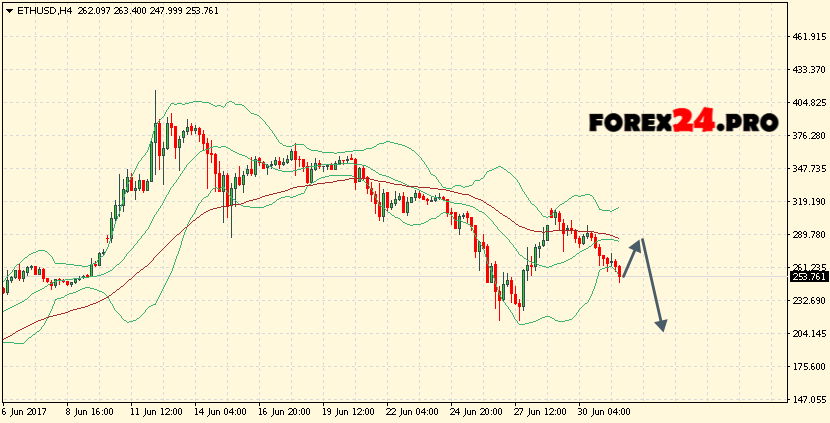
The conservative sales area ETHEREUM is located near the upper boundary of the Bollinger Bands indicator strip at 315 level. The abolition of the continuation of the fall of the ETH/USD cryptocurrency will be a breakdown of the upper border of the Bollinger Bands indicator strips, as well as a moving average with a level of 55 and the closing of quotations ETHEREUM above the area 330, which will indicate a change in the trend in favor of bullish trend on ETH/USD. In the event of a breakdown of the lower boundary of the Bollinger Bands indicator bars, it is expected to accelerate the fall of the cryptocurrency into the area below the level of 205.