

Ethereum ETH/USD are traded at the level of 191 and continue to move within the limits of the decline. The capitalization of the cryptocurrency at the time of publication of the forecast is $19 520 224 700. At this point, we should expect a test of the resistance level near the area of 200. Again, we expect a rebound and the continued decline in the Ethereum rate with a target below 155.
Ethereum forecast & technical analysis September 12, 2018
In favor of declining quotations ETH/USD will test the trend line on the indicator of relative strength index (RSI), as well as test the upper boundary of the bearish channel. Canceling the variant of the fall of the crypto currency will be a strong growth and breakdown at level 215, which will indicate the breakdown of the resistance level and the continuation of the growth of ETH/USD above the level of 245. With the breakdown of the support area and the closing of quotes below 180, it is necessary to confirm the development of the bearish movement in Ethereum.
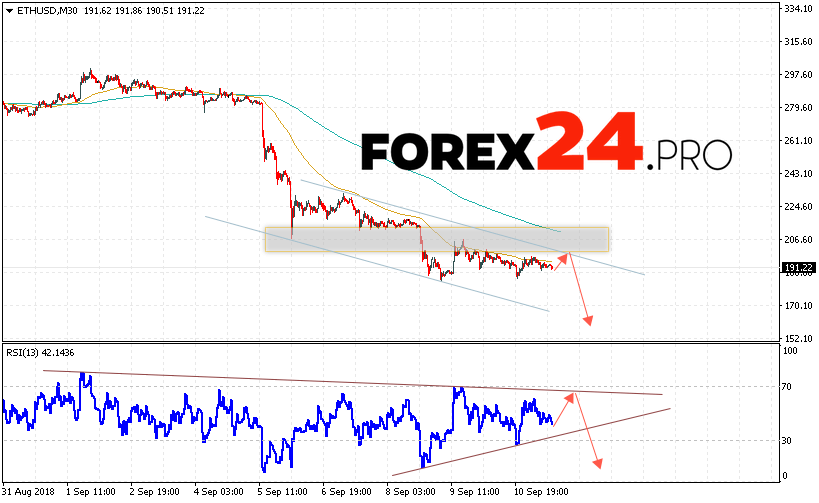
Ethereum forecast & technical analysis September 12, 2018 suggests an attempt to test the resistance area near the 200 level, from which it is expected to rebound and continue falling of the ETH/USD cryptocurrency in the area below the level of 155, an additional signal in favor of the Ethereum decline will be a resistance line test at an indicator of relative strength index (RSI), the abolition of the variant of the fall of the digital currency, there will be a strong growth and breakdown of the region 215, which will indicate the continuation of growth with a potential target above the level of 245.