
 technical analysis on March 20, 2018")
Ethereum ETH/USD are traded at 543 and continue to move within a bearish trend. At this point, we should expect a test of the resistance level near the area of 570. Again, we expect a rebound and the continued decline in the Ethereum rate with a target below the level of 350.
Ethereum (ETH/USD) technical analysis on March 20, 2018
In favor of falling quotations ETH/USD will test the resistance line on the indicator of relative strength index (RSI), as well as test the upper boundary of the bearish channel. The cancellation of the fall option will result in a strong growth and breakdown of the level of 600, which will indicate the breakdown of the upper boundary of the bearish channel and the continuation of the growth of ETH/USD above the level of 750. With the breakdown of the support area and the closing of quotes below 400, it is necessary to confirm the development of the bearish trend in Ethereum.
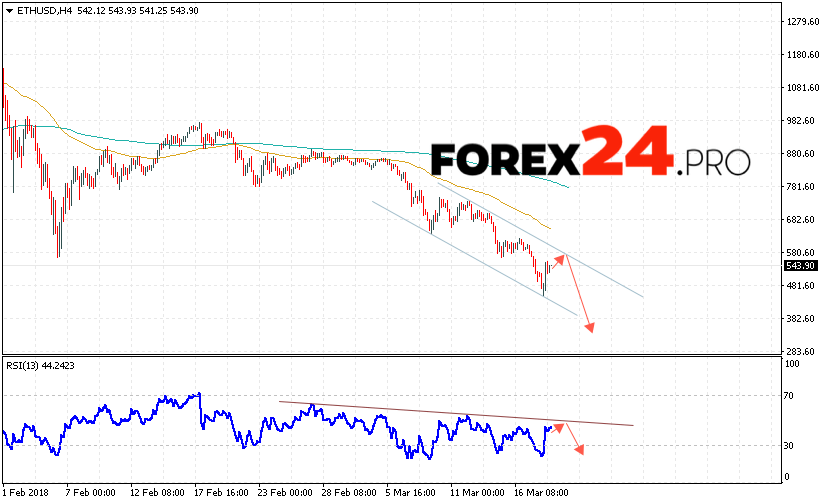
Ethereum (ETH/USD) technical analysis on March 20, 2018 suggests an attempt to test the resistance level near the area of 570, from which it is expected to rebound and continue falling to the area below the level of 350, an additional signal in favor of Ethereum fall will be a test of the bearish trend line on the indicator of relative strength index (RSI).