

Ethereum ETH/USD completes the trading week at 354 and continues to move in a bearish trend. At this point, we should expect an attempt at a resistance level near the area of 420. Again, we should expect a rebound and the continued decline in the Ethereum rate with a target below the level of 235.
Ethereum weekly forecast & analysis August 13 — 17, 2018
In favor of lowering quotations ETH/USD will test the resistance line on the indicator of relative strength index (RSI), as well as test the upper boundary of the descending channel. The reversal of the fall option will be a strong growth and breakdown of the level of 445, which will indicate the breakdown of the upper boundary of the channel and the continuation of the growth of ETH/USD. Confirmation of the decrease of the cryptocurrency will be the breakdown of the support area and the closing of quotations below the level of 310.
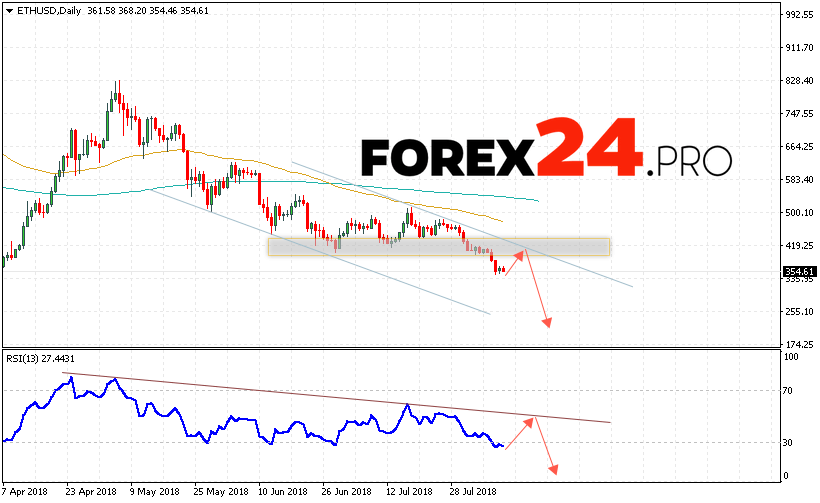
Ethereum weekly forecast & analysis August 13 — 17, 2018 suggests a test of the resistance area near the level of 420, from which it is expected to rebound and continue falling of the cryptocurrency in the area below the level of 235, an additional signal in favor of Ethereum decline will be a breakdown of the trend line on the indicator of relative strength index (RSI), the abolition of the fall option will be the breakdown of the area 445.