

Ethereum ETH/USD completes the trading week at 273 and continues to move within the bearish trend. At this point, we should expect an attempt at a resistance level near the area of 355. Where again we should expect a rebound and the continued decline in the Ethereum rate with a potential target below the level of 135.
Ethereum weekly forecast & analysis August 27 — 31, 2018
In favor of the decline in quotations ETH/USD on the current trading week on August 27 — 31, 2018, a resistance line test will be performed on the relative strength index (RSI), as well as a test of the upper boundary of the bearish channel. The cancellation of the fall option will be a strong growth and breakdown of the level 440, which will indicate the breakdown of the upper border of the channel and the continuation of the growth of ETH/USD to the target at all levels of 640. A confirmation of the decrease of the Ethereum cryptocurrency will be the breakdown of the support area and the closing of quotations below the level of 250.
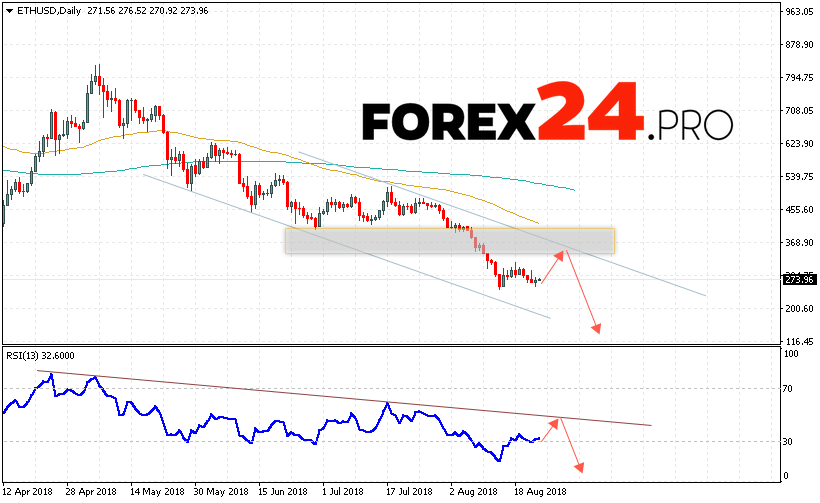
Ethereum weekly forecast & analysis August 27 — 31, 2018 suggests an attempt to test the resistance area near the level of 355, from which it is expected to rebound and continue falling of the cryptocurrency in the area below the level of 135, an additional signal in favor of Ethereum decline will be a test of the trend line on the indicator of relative strength index (RSI), the abolition of the fall option will be the breakdown of area 440, in which case it is expected to complete the downward trend and continue growth.