




Ethereum concludes the trading week with a decline, remaining within a bearish channel. The ETH/USD exchange rate is currently positioned near the 1928 level. Moving averages indicate a bearish trend for ETH/USD. Prices have broken downward through the area between the signal lines, signaling mounting pressure from sellers and the potential for a continued decline from current levels. In the near term, we may see an attempt at a bullish corrective rebound, testing the resistance area near 2235. From there, a downward reversal is expected, leading to a further decline in Ethereum’s value, with a potential target below the 745 level for the week.
Ethereum Forecast ETHUSD November 16 – 20, 2026
An additional signal supporting a decline in ETH/USD for the week of November 16–20, 2026, is a test of the downward trend line on the Relative Strength Index (RSI). A second signal would be a rebound from the lower boundary of the bullish channel. The bearish outlook for the week would be invalidated by a strong rally that breaks through the 2945 level; such a move would signify a breakout above the resistance zone and suggest further gains for ETH/USD, with a potential target above 3665. A confirmation of the decline in Ethereum would be a breakdown of the support area, with prices closing below the 1705 level—indicating a breach of the lower boundary of the bullish channel.
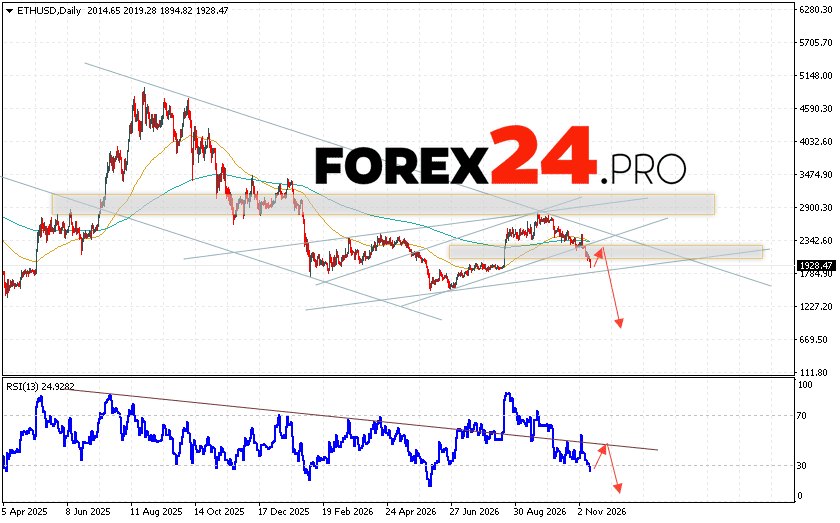
Ethereum Forecast ETHUSD November 16 – 20, 2026 suggests an attempt at a bullish correction, testing the resistance area near the 2235 level. From there, a downward rebound is expected, leading to a continued decline in the cryptocurrency toward the area below 745. An additional signal supporting a drop in the Ethereum price would be a test of the trend line on the Relative Strength Index (RSI). The bearish scenario would be invalidated by a strong rally and a breakout above the 2945 area; in that case, further gains could be expected, targeting levels above 3665.
