




The GBP/USD currency pair continues its downward movement within a bearish channel. At the time of this forecast, the exchange rate stands at 1.3244. Moving averages indicate a short-term bearish trend. Prices have broken downward through the area between the signal lines, signaling selling pressure and a potential continuation of the decline. In the immediate term, a bullish correction attempt is expected, testing the resistance area near the 1.3305 level. From there, a downward rebound and a resumption of the pair’s decline are anticipated. The target for this downward move is the 1.3105 level.
GBP/USD Forecast and Analysis for September 28, 2026
An additional signal favoring a decline is a test of the trend line on the Relative Strength Index (RSI). A second bearish signal would be a rebound from the upper boundary of the bearish channel. The bearish scenario would be invalidated by a strong rise and a breakout above the resistance area, with the price stabilizing above 1.3385. This would indicate a breakout from the pattern’s upper boundary and a continued rise toward the 1.3565 level. Confirmation of the decline should be sought via a breakout of the local support level and a price close below 1.3175.
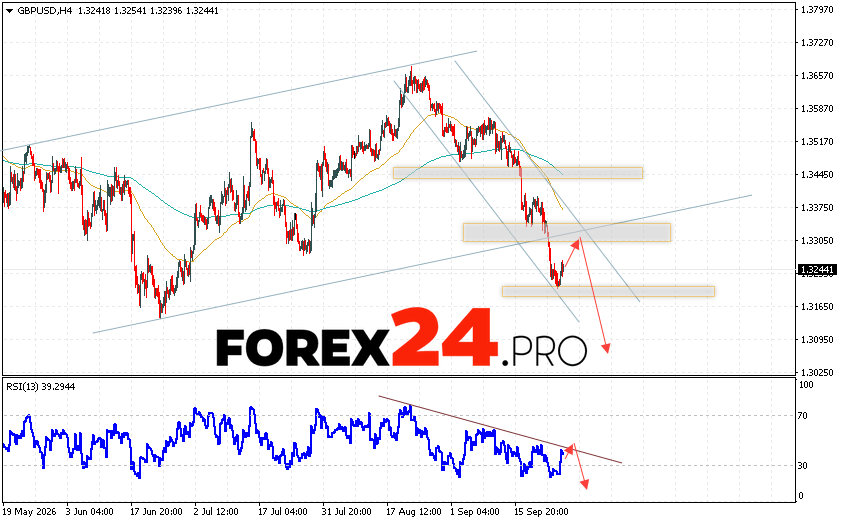
GBP/USD Forecast and Analysis for September 28, 2026 suggests an attempt to develop a bullish correction and test the resistance area near the 1.3305 level. This would be followed by a continued decline in quotes, targeting the area near 1.3105. A test of the resistance line on the Relative Strength Index (RSI) will serve as an additional signal favoring a decline in the British Pound. The bearish scenario would be invalidated by a strong rise in the British Pound against the US Dollar and a breakout above the 1.3385 area. This would indicate a continued rise for the Forex pair, with a potential target above the 1.3565 level.
