



The GBP/USD currency pair ends the trading week in a phase of decline, characterized by the formation of a “Triangle” pattern. At the time of this forecast, the British Pound to US Dollar exchange rate stands at 1.3375. While moving averages suggest an underlying bullish trend, the price has broken downward through the area between the signal lines; this indicates selling pressure and the potential for a continued decline in the British Pound against the US Dollar from current levels. In the near term, we may see an attempt at a bullish correction, testing the resistance zone near 1.3425, followed by a downward rebound and a further decline toward levels below 1.2905.
GBPUSD Weekly Forecast November 9 – 13, 2026
An additional signal supporting a decline in the British Pound would be a test of the resistance line on the Relative Strength Index (RSI). A second signal would be a rebound from the upper boundary of the “Triangle” pattern. The bearish scenario for the week of November 9–13, 2026, would be invalidated by a strong rally that breaks through the 1.3735 level—a move that would signal a breakout above the resistance zone and point toward further gains, potentially reaching levels above 1.3985. Conversely, a breakdown of the support zone, with the price closing below 1.3105, would confirm the bearish outlook, signaling a breach of the “Triangle” pattern’s lower boundary and the activation of the pattern’s downward targets.
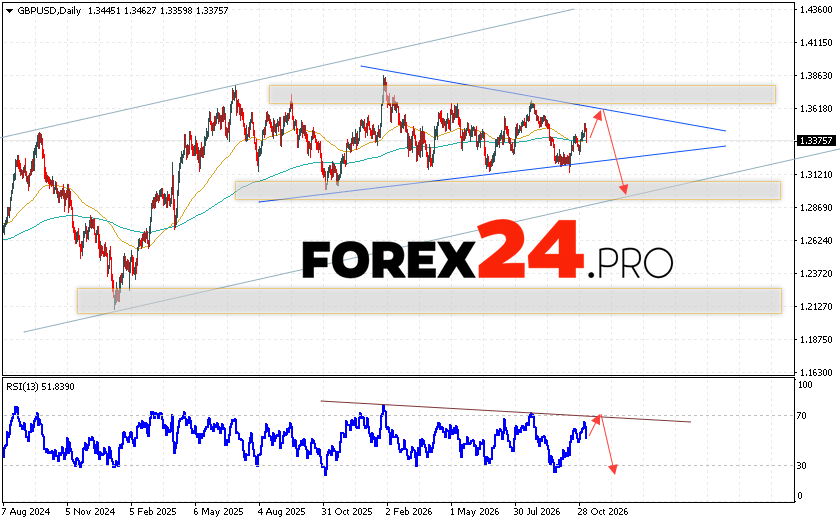
GBPUSD Weekly Forecast November 9 – 13, 2026 suggests an attempt at a bullish correction, with a test of the resistance level near the 1.3425 area. From there, a resumption of the decline is expected, targeting levels below the 1.2905 area. An additional signal supporting a decline would be a test of the trend line on the Relative Strength Index (RSI) indicator. The bearish scenario for the GBP/USD pair would be invalidated if the price rises and breaks through the 1.3735 level; in that case, further upside movement should be expected, with a potential target above the 1.3985 level.
