




XAU/USD quotes continue to move within the context of a correction and the formation of a “Triangle” pattern. At the time of this forecast, the price of gold stands at 3,875 US dollars per troy ounce. Moving averages indicate a short-term bearish trend. Prices have broken below the area between the signal lines, pointing to pressure from sellers and a potential continued decline from current levels. For now, one might expect an attempt at a rebound, with a test of the resistance area near 3,885. From there, a downward bounce is likely, leading to a further decline in the price of gold toward a potential target below the 3,725 level.
GOLD Forecast and XAUUSD Analysis for November 18, 2026
An additional signal favoring a decline in XAU/USD would be a test of the resistance line on the Relative Strength Index (RSI) indicator. A second signal would be a reversal away from the upper boundary of the “Triangle” pattern. The scenario involving a decline in gold prices on November 18, 2026, would be invalidated by a strong rally and a breakout above the 3920 level. Such a move would signal a breakout from the upper boundary of a “Triangle” pattern, pointing to further gains toward levels above 4185. An acceleration in the decline of XAU/USD is expected if the support area is breached and the price closes below 3805; this would indicate a breakout below the lower boundary of the “Triangle” pattern, triggering the downward-targeting setup.
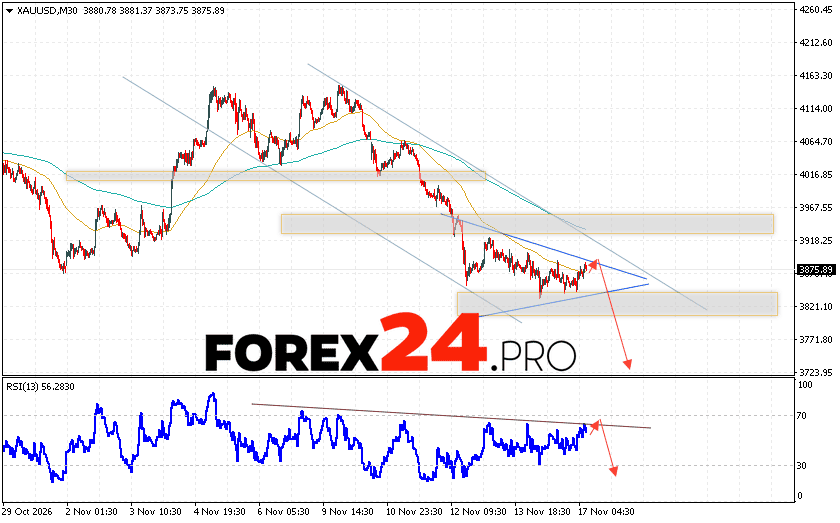
GOLD Forecast and XAUUSD Analysis for November 18, 2026 suggests an attempt at a bullish correction, with a test of the resistance area near 3885. This would be followed by a resumption of the decline, targeting levels below 3725. The scenario for a drop in gold prices would be invalidated by a strong surge in the asset’s value, resulting in a breakout above 3920. This would signal a continued rise in the price of gold, with a potential target above the 4185 mark.
