




Gold concludes the trading week with a decline, hovering near the 4049 level. XAU/USD quotes continue to move within a downward trend, forming a “Wedge” pattern. Moving averages indicate a bearish trend for Gold. Prices have broken below the area between the signal lines, which suggests pressure from buyers and the potential for a subsequent price increase. In the near term, one should anticipate an attempt at a decline, testing the support level near 3845. This is expected to be followed by an upward rebound and a continuation of the XAU/USD rally throughout the current trading week, with a potential target above the 4995 level.
GOLD Weekly Forecast XAUUSD November 9 – 13, 2026
An additional signal supporting an increase in Gold prices during the week of November 9–13, 2026, is a rebound from the support line on the Relative Strength Index (RSI) indicator. A second signal is a bounce off the lower boundary of the bullish “Wedge” pattern. The bullish scenario for XAU/USD would be invalidated if the price falls and breaks through the 3495 area. Such a move would signify a breach of the lower boundary of the bullish channel, leading to a continued decline in Gold prices toward a target below 3165. Conversely, a breakout above the resistance area—confirmed by a close above the 4265 level—would indicate a breach of the upper boundary of the “Wedge” pattern, signaling the activation of the pattern with upward targets.
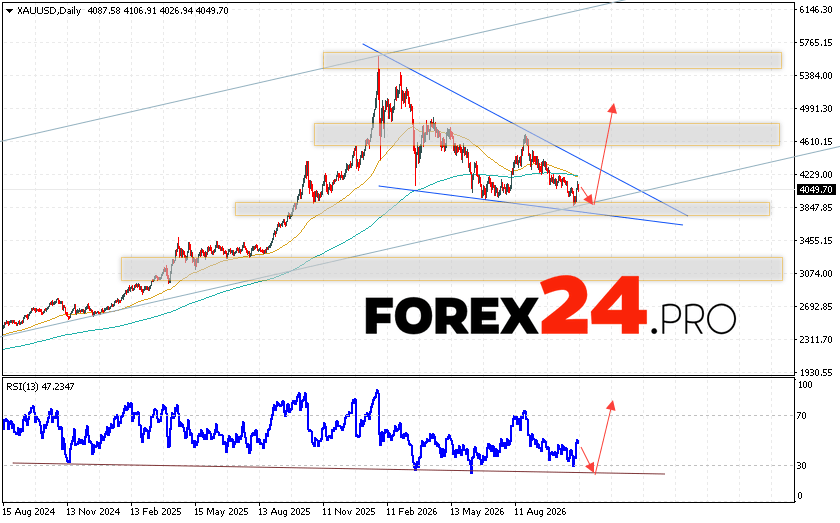
GOLD Weekly Forecast XAUUSD November 9 – 13, 2026 suggests an attempt to develop a bearish correction and test the support level near the 3845 area. This would be followed by a resumption of the rise in gold prices, with a target above the 4995 level. A test of the trend line on the Relative Strength Index (RSI) indicator would support an upward move. The bullish scenario would be invalidated if the price falls and breaks below the 3495 level, which would signal a continued decline toward the area below 3165.
