

The stock index S&P 500 is trading at the level of 2385.6. The S&P 500 is trading above the moving average with a period of 55, indicating a bullish trend for the S&P 500. At this point, the stock index moves towards the lower border of the Bollinger Bands indicator bars. It is worth to expect an attempt at a minor correction near the level of 2381.0, where again we should expect an attempt to continue the growth and development of the bullish trend for the S&P 500 with the first target near the level of 2406.0.
Bollinger Bands S&P 500 Forecast on May 4, 2017
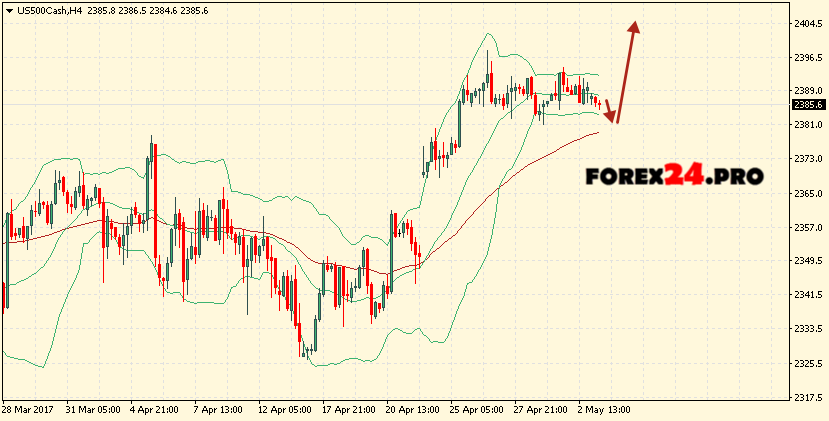
The conservative buying area is located near the lower border of the Bollinger Bands indicator strip at 2384.0. The abolition of the continuation of the growth of the S&P 500 will be the breakdown of the lower boundary area, as well as the moving average with a period of 55 and the closing of quotes of the pair below the area of 2369.0, which indicates a change in the trend in favor of the bearish S&P 500. In the event of breakdown of the upper boundary of the indicator bands, Exchange index in the area above the level of 2406.0.