




The USD/CAD currency pair is ending the trading week on an upward note, forming a “Wedge” reversal pattern. Moving averages point to a bullish trend. Prices have broken upward through the area between the signal lines, indicating mounting pressure from buyers and the potential for further gains in the near term. For now, we can expect an attempt to extend the rally and test the resistance level near 1.4375, followed by a downward rebound and a decline in quotes toward a target below 1.3885.
USD/CAD Weekly Forecast November 23 – 27, 2026
An additional signal favoring a decline in the USD/CAD pair would be a test of the resistance line on the Relative Strength Index (RSI) indicator. A second signal would be a rebound from the upper boundary of the “Wedge” reversal pattern. The scenario calling for a decline in the USD/CAD pair during the week of November 23–27, 2026, would be invalidated by a strong rally that breaks through the 1.4785 level; this would signal a breakout of resistance and a continuation of the uptrend toward the area above 1.5065. A decline would be confirmed if the price breaks through the support level and closes below 1.3985, indicating a breach of the lower boundary of the “Wedge” pattern and the onset of the pattern’s downward-reaching targets.
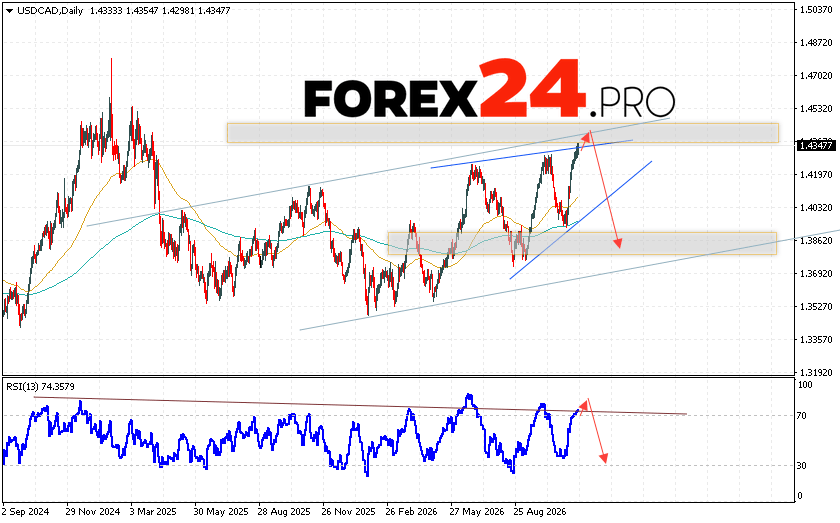
USD/CAD Weekly Forecast November 23 – 27, 2026 anticipates an attempt at a correction and a test of the resistance area near the 1.4375 level. Furthermore, a continued decline is expected, targeting levels below 1.3885. A test of the resistance line on the Relative Strength Index (RSI) would serve as an additional signal favoring a downward move. This bearish scenario would be invalidated by a strong rally and a breakout above the 1.4785 area; such a move would signify a breach of a key resistance level and point to further upside, with a target above 1.5065.
